version v7.2.
For up-to-date documentation, see the
latest version.
Operations Guide
8 minute read
Document maturity: DRAFT
⚠IMPORTANT NOTICE!
Starting with version 8.0.0, Synopsys Alert has been renamed Black Duck Alert. For legacy and structure reasons in the current document, any reference to Synopsys Alert product name can be used interchangeable with Black Duck Alert. Outside of this, any code block, reference to a value/parameter should be used “as is”.
Referenced documentation
| Document reference | Document Name |
|---|---|
| TASD | Technical Architecture and Security Document of SWaaP |
| LLD-BlackDuckAlert | Low level design of Black Duck Alert component |
Introduction
The Black Duck Alert component is part of Software Factory as a Package (SWaaP).
Black Duck Alert enables you to see the Black Duck notifications you want, where and when you want them. Alert supports a number of commonly used distribution channels, such as email, Slack, Azure Boards, and Jira. Alert streamlines the process of getting timely, valuable Black Duck related notifications to key stakeholders. Alert is an independent web application that runs on its own with its own user interface. Once configured, it runs continuously in the background receiving notifications from Black Duck and delivering those notifications to configured recipients using the configured channels. Administrators can verify the successful sending of notifications through the Alert Audit screen.
Learn more about it in LLD-BlackDuckAlert and in TASD .
Billing and Onboarding
Black Duck Alert is part of the Advanced Software Composition Analysis (SCA) offer together with Black Duck SCA.
Billing & Onboarding on TDP
The Advanced Software Composition Analysis (SCA) offer is not available yet.
Billing & Onboarding on RTDP
The Advanced Software Composition Analysis (SCA) offer is not available yet.
Billing & Onboarding on CASTLE
The Advanced Software Composition Analysis (SCA) offer is not available yet.
Component Deployment and Configuration
Requirements & Pre-requisite
See LLD-BlackDuckAlert §4.2 prerequisites & Limitations
Configuration
Setting Helm Values
Black Duck Alert component is part of SWaaP. For more information, refer to the Mandatory Black Duck Alert values section in the reference repository.
Configuring Kubernetes Secrets
Configuring Kubernetes secrets - Black Duck Alert
Note that, based on the [Helm] values you provide, additional Kubernetes secrets and configmaps may also be required.
Deployment & Update Procedure
Black Duck Alert deployments and upgrades are automated using Flux, a GitOps framework.
Here’s an example of a Release YAML file used for deployment and upgrade.
apiVersion: helm.toolkit.fluxcd.io/v2beta1
kind: HelmRelease
metadata:
  name: synopsys-alert
spec:
  releaseName: synopsys-alert
  chart:
    spec:
      chart: blackduck-alert
      version: 8.0.0
      sourceRef:
        kind: HelmRepository
        name: synopsys-alert
  install:
    crds: Skip
  upgrade:
    crds: Skip
  interval: 10m
  timeout: 20m

  valuesFrom:
    # Default values of the chart. Shall not be modified.
    - kind: ConfigMap
      name: helm-common-values
      valuesKey: swf-chart-default-values.yaml
    # All overrides are here (if not in a more specialized files below)
    - kind: ConfigMap
      name: helm-common-values
      valuesKey: swf-overrides-default-all.yaml
    # Overrides related to the usage of a private registry
    - kind: ConfigMap
      name: helm-images-values
      valuesKey: swf-overrides-var-images.yaml
    # These platform specific Values shall always exist. Even empty.
    - kind: ConfigMap
      name: helm-sizing-values
      valuesKey: sizing.yaml
    - kind: ConfigMap
      name: helm-platform-values
      valuesKey: platform.yaml
    - kind: Secret
      name: alertencryption
      valuesKey: password
      targetPath: alertEncryptionPassword
      optional: true
    - kind: Secret
      name: alertencryption
      valuesKey: password
      targetPath: secretEnvirons.ALERT_ENCRYPTION_PASSWORD
      optional: true
    - kind: Secret
      name: alertencryption
      valuesKey: salt
      targetPath: alertEncryptionGlobalSalt
      optional: true
    - kind: Secret
      name: alertencryption
      valuesKey: salt
      targetPath: secretEnvirons.ALERT_ENCRYPTION_GLOBAL_SALT
      optional: true
  postRenderers:
    - kustomize:
        patches:
          - target:
              kind: Deployment
            patch: |
              - op: add
                path: /metadata/annotations/linkerd.io~1inject
                value: disabled
              - op: add
                path: /spec/template/metadata/annotations/linkerd.io~1inject
                value: disabled
apiVersion: source.toolkit.fluxcd.io/v1beta2
kind: HelmRepository
metadata:
  name: synopsys-alert
spec:
  interval: 30m
  url: ${helmRepositoryUrl:="https://repo.blackduck.com/sig-cloudnative"}
Note:
Before any upgrade please back up existing data (DB, Storage, etc)
Official docs for deployment and upgrade:
IMPORTANT NOTICE! (when upgrading to Blackduck Alert 8.0.0 )
⚠ Synopsys Alert has been renamed Black Duck Alert and also the helmchart name was renamed from
synopsys-alerttoblackduck-alert.- This doesn’t generate any impact for regular Helm upgrades.
- For Flux upgrades, this will cause an uninstall of the current version
(installed from
synopsys-alerthelmchart) and an actual install (instead of upgrade) with the new “blackduck-alert” helmchart, resulting in PV/PVCs recreation. Checked the scenario and this has no real impact on the platform as there are no critical files affected. More on this in the documentation
⚠ A new flag
postgres.sslModehas been added when using an external DB with helm .- The default ssl mode is now set as ‘disable’ throughout the deployment files.
- With SSL enabled, if
postgres.sslUseFilesis true, Alert will now individually verify the settings;postgres.sslSecrets,postgres.sslSecrets.sslKeyKey,postgres.sslSecrets sslCertKey, andpostgres.sslSecrets.sslRootCertKey. For any flags set, the deployment will add the secret to the pod. - The
docker-entrypointscript for Alert will now dynamically configure the DB connection string for sslkey, sslcert, and sslrootcert. If the script finds the value to be set, it will include it in the connection string otherwise it will not be included. postgres.sslKeyKeyandpostgres.sslCertKeyvalues must both be specified. Configuring just one or the other is invalid, and they will be ignored when Alert starts.
Settings
PostgreSQL configuration YAML file, e.g. pg.yaml Postgress configuration
The exposed parameter postgres.claimSize only applies to Postgress instance
deployed by alert (not external).
| Parameter | Description | Default |
|---|---|---|
postgres.claimSize | Postgres node volume claim size | "5Gi" |
The persistance size for Postgress service is set in pg.yaml
primary:
  persistence:
    size: 10Gi
Black Duck Alert platform setup, installation and deployment YAML file, e.g. platform.yaml Black Duck Alert configuration
Sizing configuration file for components in Black Duck Alert deployment, e.g. sizing.yaml
| Parameter | Description | Default |
|---|---|---|
alert.resources.limits.memory | Alert container Memory Limit | 2560M |
alert.resources.requests.memory | Alert container Memory Request | 2560M |
alert.claimSize | The persistent storage claim size limit | 5Gi |
rabbitmq.claimSize | RabbitMQ node volume claim size | "2Gi" |
rabbitmq.resources.limits.memory | RabbitMQ node memory limit | "1024Mi" |
Currently in SWaaP, Black Duck Alert is configured with enableStandalone set to false
meaning Alert uses the cfssl pod from blackduck’s namespace.
The below limits for the cfssl pod are only relevant if enableStandalone is set to true.
| Parameter | Description | Default |
|---|---|---|
enableStandalone | If true, Alert will be deployed with it’s own cfssl instance | true |
cfssl.resources.limits.memory | Cfssl container Memory Limit | 640M |
cfssl.resources.requests.memory | Cfssl container Request Limit | 640M |
Note: Please note that the values are placeholders and can be customized as per your requirements.
For the full list of Black Duck Alert configurable paramentes check out Black Duck Alert Helm Chart Configuration
Once Alert is installed you will need to configure it. Some configurations like encryption and certificates are handled on install. Both can also be configured from the web UI, should the need arise for a new integration (e.g. for adding a JIRA certificate)
Functional Configuration
Depending on what you want to use, you will need to configure providers (BlackDuck), the channels to use for notifications and scheduling.
General configuration: Configuring Black Duck Alert
Configure how Alert sends notifications:
- Configuring Black Duck Providers
- Configuring Channels in Alert
- Configuring Distribution Jobs
- Scheduling Notifications
- Troubleshooting Alert
Black Duck does not specify an autoscaling strategy for Alert. Since Alert does not use too many resources we recommend increasing the resources for the deployed pods if the need arrises (high CPU, high memory consumption).
Monitoring
Black Duck Alert is deployed with a Swagger documentation endpoint.
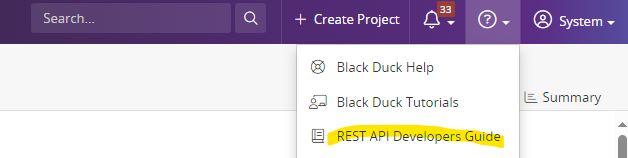
In order to access the swagger endpoint go to the alert web UI
and select on Help then on REST API Developers Guide.
This will take you to the Swagger API documentation of Alert.
Alert provides a diagnostics endpoint that returns relevant system and business metrics.
The diagnostics endpoint is hosted at synopsys-alert-url/api/diagnostic.
Performing a GETrequest with no parameters will return a dictionary in JSON format,
containing diagnostic data objects with the diagnostic values.
Example request using curl:
curl -X 'GET' \
  'https://alert_url/api/diagnostic' \
  -H 'accept: */*'
Example diagnostics response:
{
  "notificationDiagnosticModel": {
    "numberOfNotifications": 0,
    "numberOfNotificationsProcessed": 0,
    "numberOfNotificationsUnprocessed": 0,
    "providerNotificationCounts": [
      {
        "providerConfigId": 0,
        "notificationCounts": [
          {
            "notificationType": "BOM_EDIT",
            "count": 0
          }
        ]
      }
    ]
  },
  "auditDiagnosticModel": {
    "numberOfAuditEntriesSuccessful": 0,
    "numberOfAuditEntriesFailed": 0,
    "numberOfAuditEntriesPending": 0,
    "averageAuditTime": "string"
  },
  "systemDiagnosticModel": {
    "availableProcessors": 0,
    "maxMemory": 0,
    "totalMemory": 0,
    "freeMemory": 0,
    "usedMemory": 0
  },
  "rabbitMQDiagnosticModel": {
    "queues": [
      {
        "name": "string",
        "messageCount": 0,
        "consumerCount": 0
      }
    ]
  },
  "completedJobsDiagnosticModel": {
    "completedJobs": [
      {
        "jobConfigId": "3fa85f64-5717-4562-b3fc-2c963f66afa6",
        "jobName": "string",
        "latestNotificationCount": 0,
        "totalNotificationCount": 0,
        "successCount": 0,
        "failureCount": 0,
        "latestStatus": "string",
        "lastRun": "string",
        "durations": {
          "jobDuration": "string",
          "stageDurations": [
            {
              "name": "string",
              "duration": "string"
            }
          ]
        }
      }
    ]
  },
  "jobExecutionsDiagnosticModel": {
    "totalJobsInSystem": 0,
    "pendingJobs": 0,
    "successFulJobs": 0,
    "failedJobs": 0,
    "jobExecutions": [
      {
        "jobName": "string",
        "channelName": "string",
        "start": "string",
        "end": "string",
        "status": "PENDING",
        "processedNotificationCount": 0,
        "totalNotificationCount": 0,
        "remainingEvents": 0,
        "stages": [
          {
            "stage": "NOTIFICATION_PROCESSING",
            "start": "string",
            "end": "string"
          }
        ]
      }
    ]
  },
  "requestTimestamp": "string"
}
For a complete definition of the schemas for the Diagnostic Model objects check out Alert Swagger.
System health metrics
SystemDiagnosticModel{
  availableProcessors integer($int32)
  maxMemory integer($int64)
  totalMemory integer($int64)
  freeMemory  integer($int64)
  usedMemory  integer($int64)
}
RabbitMQDiagnosticModel{
  queues  [AlertQueueInformation{
    name  string
    messageCount  integer($int32)
    consumerCount integer($int32)
  }]
}
AlertQueueInformation{
  name  string
  messageCount  integer($int32)
  consumerCount integer($int32)
}
Business Metrics
Schema of the response from diagnostics endpoint, containing bussiness metrics:
DiagnosticModel {
    notificationDiagnosticModel NotificationDiagnosticModel {
        numberOfNotifications integer($int64)
        numberOfNotificationsProcessed integer($int64)
        numberOfNotificationsUnprocessed integer($int64)
        providerNotificationCounts[ProviderNotificationCounts {
            providerConfigId integer($int64)
            notificationCounts[NotificationTypeCount {
                notificationType string
                  Enum: [BOM_EDIT, COMPONENT_UNKNOWN_VERSION, LICENSE_LIMIT, POLICY_OVERRIDE, PROJECT, PROJECT_VERSION, RULE_VIOLATION, RULE_VIOLATION_CLEARED, VERSION_BOM_CODE_LOCATION_BOM_COMPUTED, VULNERABILITY]
                count integer($int64)
            }]
        }]
    }
    auditDiagnosticModel AuditDiagnosticModel {
        numberOfAuditEntriesSuccessful integer($int64)
        numberOfAuditEntriesFailed integer($int64)
        numberOfAuditEntriesPending integer($int64)
        averageAuditTime string
    }
    systemDiagnosticModel SystemDiagnosticModel {
        availableProcessors integer($int32)
        maxMemory integer($int64)
        totalMemory integer($int64)
        freeMemory integer($int64)
        usedMemory integer($int64)
    }
    rabbitMQDiagnosticModel RabbitMQDiagnosticModel {
        queues[AlertQueueInformation {
            name string
            messageCount integer($int32)
            consumerCount integer($int32)
        }]
    }
    completedJobsDiagnosticModel CompletedJobsDiagnosticModel {
        completedJobs[CompletedJobDiagnosticModel {
            jobConfigId string($uuid)
            jobName string
            latestNotificationCount integer($int64)
            totalNotificationCount integer($int64)
            successCount integer($int64)
            failureCount integer($int64)
            latestStatus string
            lastRun string
            durations CompletedJobDurationDiagnosticModel {
                jobDuration string
                stageDurations[CompletedJobStageDurationModel {
                    name string
                    duration string
                }]
            }
        }]
    }
    jobExecutionsDiagnosticModel JobExecutionsDiagnosticModel {
        totalJobsInSystem integer($int64)
        pendingJobs integer($int64)
        successFulJobs integer($int64)
        failedJobs integer($int64)
        jobExecutions[JobExecutionDiagnosticModel {
            jobName string
            channelName string
            start string
            end string
            status string
              Enum: [PENDING, SUCCESS, FAILURE]
            processedNotificationCount integer($int32)
            totalNotificationCount integer($int32)
            remainingEvents integer($int32)
            stages[JobStageDiagnosticModel {
                stage string
                  Enum: [NOTIFICATION_PROCESSING, CHANNEL_PROCESSING, ISSUE_CREATION, ISSUE_COMMENTING, ISSUE_TRANSITION]
                start string
                end string
            }]
        }]
    }
    requestTimestamp string
}