version v7.2.
For up-to-date documentation, see the
latest version.
Operations Guide
19 minute read
Document maturity: DRAFT
Referenced documentation
| Document reference | Document Name |
|---|---|
| TASD | Technical Architecture and Security Document of SWaaP |
| LLD-GitLab | Low level design of GitLab component |
Introduction
The GitLab component is part of Software Factory as a Package (SWaaP).
GitLab is a comprehensive DevSecOps platform that provides a web-based Git repository manager. It offers a wide range of features to support the entire software development lifecycle, from project planning and source code management to CI/CD (Continuous Integration/Continuous Deployment), monitoring, and security.
Learn more about it in LLD-GitLab and in TASD .
Billing and onboarding
This section aims at describing how billing related to the component is managed and at specifying offers including access to the component.
General billing principles:
- The price of the licenses is the same across all platforms
- The price of the infrastructure varies per platform
- The licenses are paid only once, regardless of the number of platforms the user is working on
- The infrastructure costs are cumulative
- The chargeback model is available [on SharePoint](the chargeback model )
Billing & onboarding on TDP
To onboard, use Get access to Software Solutions .
To offboard, use Unsubscribe from a pack or a license .
Billing & onboarding on RTDP
RTDP boarding will be done through PostIT soon. Until then, follow this procedure .
Billing & onboarding on CASTLE
To onboard, refer to Software Factory on CASTLE documentation
Component deployment and configuration
Requirements & Pre-requisite
See LLD-GitLab §4.2 prerequisites
Configuration
Setting Helm values
Mandatory GitLab values are described in the SWaaP Readme - Helm values .
There’s also a list of required and optional ConfigMaps that are needed. These are described in the GitLab package readme document
Configuring Kubernetes secrets
The required GitLab secrets and how they are created is described in the SWaaP Readme - GitLab secrets .
Deployment & update procedure
The deployment and update procedures are described in the SWaaP Readme - Quick start section .
Settings
API rate limiting (GitLab ≥ 18.3)
This subsection clarifies how REST API rate limits are applied for the Projects, Groups, and Users APIs and provides operational guidance for SWaaP-operated instances.
Version behavior and rollout
- New installations: Starting with GitLab 18.3, new self-managed installations apply default API rate limits for the endpoints listed below. (On GitLab.com these limits are enforced and cannot be changed.)
- Upgrades: Existing installations upgrading to 18.3 (or beyond) retain whatever settings
they already had
(including
0= unlimited) unless an administrator changes them. Earlier in the rollout, the feature was disabled by default for self-managed in 18.0 (with a feature flag) and the flag was removed in 18.1, preserving existing values.
Administration and customization
Administrators can configure these limits:
- Admin UI path: Admin → Settings → Network under:
- Projects API rate limits (set
0to disable). - Groups API rate limits (set
0to disable). - Users API rate limit (set
0to disable).
- Projects API rate limits (set
- Application Settings API: settings can be automated via the Application settings API (
/api/v4/application/settings).
Limits apply per user for authenticated requests and per IP for unauthenticated requests (same numeric value for both). When a limit is exceeded, the API returns HTTP 429 Too Many Requests.
Recommendation for SWaaP when protected by WAF (or similar)
If your SWaaP deployment is fronted by a Web Application Firewall (WAF) or any upstream system
that already enforces API request limits on the same endpoints, we recommend setting the
internal GitLab rate limits to 0 (unlimited) to avoid double enforcement and unexpected
disruptions. Apply this approach only when the external rate-limiting solution covers the
same API endpoints. (General best practice; validate with your risk owners.)
Endpoints and default values (effective by default on new installs ≥ 18.3)
Users API (per minute):
| Endpoint | Default limit |
|---|---|
GET /api/v4/users/:id/followers | 100/min |
GET /api/v4/users/:id/following | 100/min |
GET /api/v4/users/:user_id/status | 240/min |
GET /api/v4/users/:user_id/keys | 120/min |
GET /api/v4/users/:id/keys/:key_id | 120/min |
GET /api/v4/users/:id/gpg_keys | 120/min |
GET /api/v4/users/:id/gpg_keys/:key_id | 120/min |
Projects API:
| Endpoint | Default limit |
|---|---|
GET /api/v4/projects (unauthenticated) | 400 / 10 minutes |
GET /api/v4/projects (authenticated) | 2000 / 10 minutes |
GET /api/v4/projects/:id | 400 / minute |
GET /api/v4/projects/:id/members/all | 200 / minute |
GET /api/v4/users/:user_id/projects | 300 / minute |
GET /api/v4/users/:user_id/contributed_projects | 100 / minute |
GET /api/v4/users/:user_id/starred_projects | 100 / minute |
Groups API (per minute):
| Endpoint | Default limit |
|---|---|
GET /api/v4/groups | 200/min |
GET /api/v4/groups/:id | 400/min |
GET /api/v4/groups/:id/projects | 600/min |
GET /api/v4/groups/:id/members/all | 200/min |
These defaults are configurable on Self-managed and Dedicated; set a value to
0to disable a specific endpoint’s rate limiting. On GitLab.com, values are enforced and not changeable.
License
Add a license as administrator by going to the Admin area > Subscription and choosing Add activation code, input your activation code, select the agreement checkmark and select Activate.
Functional Configuration
SAML Configuration
For setting up SAML single sign on (SSO) configure omniauth as follows in platform.yaml:
global:
  appConfig:
    omniauth:
      enabled: true
      allowSingleSignOn: ['saml']
      blockAutoCreatedUsers: false]
You need to create Kubernetes secret for setting up the SAML.
Create a file named saml.yaml with the following content:
name: 'saml'
label: 'Provider name' # optional label for login button, defaults to "Saml"
args:
  assertion_consumer_service_url: 'https://gitlab.example.com/users/auth/saml/callback'
  idp_cert_fingerprint: '43:51:43:a1:b5:fc:8b:b7:0a:3a:a9:b1:0f:66:73:a8'
  idp_sso_target_url: 'https://login.example.com/idp'
  issuer: 'https://gitlab.example.com'
  name_identifier_format: 'urn:oasis:names:tc:SAML:2.0:nameid-format:persistent'
Create the Kubernetes secret:
kubectl create secret generic -n gitlab gitlab-saml-provider --from-file=provider=saml.yaml
Add the provider configuration to your values.yaml:
global:
  appConfig:
    omniauth:
      providers:
        - secret: gitlab-saml-provider
For configuring your identity providers check the Set up identity providers section in the official GitLab documentation for SAML SSO for Self Managed instances.
Turn on the diagram proxy
Turn on the diagram proxy separately for the Kroki and PlantUML integrations. You can turn on the diagram proxy for Kroki, PlantUML, or both.
Enable Kroki
With the Kroki integration, you can create diagrams-as-code within AsciiDoc, Markdown, reStructuredText, and Textile.
To enable that, sign in with an administrator account and follow these steps:
- In the upper-right corner, select Admin.
- Go to Settings > General .
- Expand the Kroki section.
- Select Enable Kroki checkbox.
- Select Proxy Kroki diagrams through GitLab checkbox.
- Enter the Kroki URL
⚠️ Security recommandation:
[!NOTE] Starting with SWaaP 7.2, which includes Kroki 1.2.0 helmchart, Kroki is no longer exposed
externally to the cluster via an ingress by default, thus the communication between GitLab and Kroki
happens internally.
If you deployed Kroki with the recommended parameters, GitLab should point to Kroki’s internal
Kubernetes service name
; Kroki URL parameter should be set to
http://kroki.kroki.svc.cluster.local:8000
- Enable all Additional diagram formats: BlockDiag,BPMN, Excalidraw, Mermaid
Kroki diagrams are not stored on GitLab, so standard GitLab access controls and other user permission restrictions are not in force.
Enable PlantUML
Use the PlantUML integration, to create diagrams in snippets, wikis, and repositories.
To enable that, sign in with an administrator account and follow these steps:
- In the upper-right corner, select Admin.
- Go to Settings > General .
- Expand the PlantUML section.
- Select Enable PlantUML checkbox.
- Select Proxy PlantUML diagrams through GitLab checkbox.
- Enter the PlantUML URL to point to Kroki URL
⚠️ Security recommandation:
[!NOTE] Starting with SWaaP 7.2, which includes Kroki 1.2.0 helmchart, Kroki is no longer exposed
externally to the cluster via an ingress by default, thus the communication between GitLab and Kroki
happens internally.
If you deployed Kroki with the recommended parameters, GitLab should point to Kroki’s internal
Kubernetes service name
; PlantUML URL parameter should be set to
http://kroki.kroki.svc.cluster.local:8000/plantuml
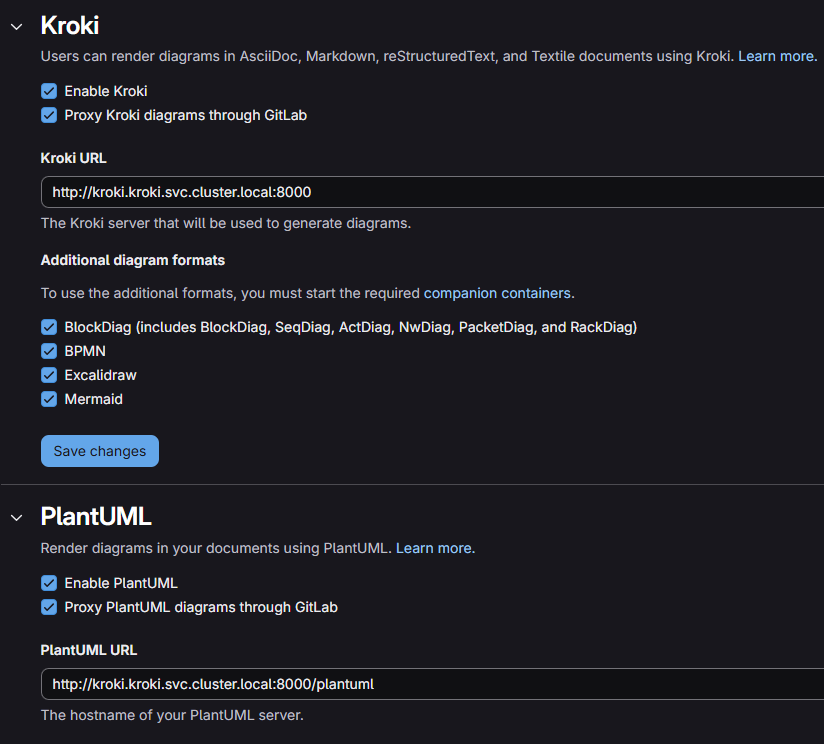
Sample configuration
⚠️ Additional network configuration when enabling diagram proxy:
- In the upper-right corner, select Admin.
- Go to Settings > Network .
- Expand the Outbound requests section.
- Select Allow requests to the local network from system hooks checkbox.
- Under Local IP addresses and domain names that hooks and integrations can
access, you need to open up access to Kroki internal instance,
by whitelisting the Kroki Kubernetes service name
:
kroki.kroki.svc.cluster.local - Select Enforce DNS-rebinding attack protection checkbox.
Disable integrations on GitLab instance
Starting with SWaaP 2.1.0 it is possible for instance administrators to control which integrations can be enabled.
Instance administrators can now configure an allowlist to control which integrations can be enabled on a GitLab instance:
- If no allowlist is configured, all integrations are allowed on the instance.
- If an empty allowlist is configured, no integrations are allowed on the instance.
- If an allowlist is configured, integrations which are not in the allowlist are disabled.
If an allowlist is configured, new GitLab integrations are not on the allowlist by default.
Previously enabled integrations that are later blocked by the allowlist settings are disabled. If these integrations are allowed again, they are re-enabled with their existing configuration.
We recommend to configure an allowlist to ensure that only your allowed integrations are enabled. We recommend the GitGuardian integration to be disabled, indeed GitGuardian is an external service which can receive all code hosted in a GitLab Project.
To achieve that follow the instructions from GitLab
Security Assessment and recommendation
Apple App Store Connect:
- Recommendation: Credentials configuration and protections shall be analyzed by security
Asana:
- Recommendation: Shall not be authorized
Assembla:
- Recommendation: Shall not be authorized
Atlassian Bamboo:
- Recommendation: Shall not be authorized
Beyond Identity
- Recommendation: Shall not be authorized
Bugzilla:
- Recommendation: Shall not be authorized
Buildkite:
- Recommendation: Shall not be authorized
Campfire:
- Recommendation: Shall not be authorized
ClickUp:
- Recommendation: Shall not be authorized
Confluence Workspace:
- Recommendation: can be used if needed
Custom issue tracker:
- Recommendation: Shall not be authorized
Datadog:
- Note: used by TDP
Diffblue Cover:
- Recommendation: Shall not be authorized
Discord Notifications:
- Recommendation: Shall not be authorized
Drone:
- Recommendation: Shall not be authorized
Emails on push:
- Recommendation: SMTP configuration shall be checked: Thales SMTP and only Thales.
EWM:
- Recommendation: Shall not be authorized
External wiki:
- Recommendation: Wiki URL shall be verified by security
GitGuardian:
- Recommendation: Shall not be authorized
GitHub:
- Recommendation: Shall not be authorized
GitLab for Jira Cloud app:
- Recommendation: Shall not be authorized
GitLab for Slack app:
- Recommendation: Shall not be authorized
Google Artifact Management:
- Recommendation: Shall not be authorized
Google Chat:
- Recommendation: Shall not be authorized
Google Cloud IAM:
- Recommendation: Shall not be authorized
Google Play:
- Recommendation: Credentials configuration and protections shall be analyzed by security
Harbor:
- Recommendation: Shall not be authorized
irker (IRC gateway):
- Recommendation: Shall not be authorized
Jenkins:
- Recommendation: Jenkins shall be validated and configuration shall be validated by security
- Recommendation: Should be only connected to Thales instances
JetBrains TeamCity:
- Recommendation: Shall not be authorized
JetBrains YouTrack:
- Recommendation: Shall not be authorized
Jira:
- Recommendation: URL / JIRA Server shall be validated by security
- Recommendation: Configurations shall be checked by security.
- Recommendation: Should be only connected to Thales instances.
Matrix notifications:
- Recommendation: Shall not be authorized
Mattermost notifications:
- Recommendation: Shall not be authorized
Mattermost slash commands:
- Recommendation: Shall not be authorized.
Microsoft Teams notifications:
- Recommendation: Shall be validated by security (use of only C2 data).
- Recommendation: Instance connected shall be checked in accordance.
- Recommendation: Should be only connected to Thales instances.
MockCI:
- Recommendation: Shall not be authorized
Mock monitoring:
- Recommendation: Shall not be authorized
- Recommendation: Restricted to dev environement. No guarantee of dev environment usage.
- Recommendation: Dev environements can include sensitive data for Thales (C2 included)
Packagist:
- Recommendation: Shall not be authorized
Phorge:
- Recommendation: Shall not be authorized
Pipeline status emails:
- Recommendation: SMTP configuration shall be checked. Emails shall be validated by security.
- Recommendation: Status sent to email address specified. Risk is about use of other than professional emails.
- Recommendation: Require to have SMTP server enable.
Pivotal Tracker:
- Recommendation: Shall not be authorized
Pumble:
- Recommendation: Shall not be authorized
Pushover:
- Recommendation: Shall not be authorized
Redmine:
- Recommendation: Shall not be authorized
Slack notification (deprecated):
- Recommendation: Shall not be authorized
Slack slash commands:
- Recommendation: Shall not be authorized
Squash TM:
- Recommendation: Shall not be authorized
Telegram:
- Recommendation: Shall not be authorized
Unify Circuit:
- Recommendation: Shall not be authorized
Webex Teams:
- Recommendation: Shall not be authorized
YouTrack:
- Recommendation: Shall not be authorized
ZenTao (deprecated):
- Recommendation: Shall not be authorized
Disable username change
We recommend disabling username change. The email address or full name are often data we trust, especially when authentication is based on the company’s SSO: the company’s directory is “trusted”.
So, if a malicious user can choose this data, he could construct a scenario to deceive interlocutors.
To disable username change at deployment time, set global.appConfig.usernameChangingEnabled
to false in platform.yaml:
global:
  appConfig:
    usernameChangingEnabled: false
SSH cryptographic settings
Any internet exposed service must have a perfect cryptographic configuration, including SSH. The attacker could use any weakness in the protocols, even if this is technically difficult.
We recommend the following remediations:
- Do not use EC algorithms from NIST
- Do not use SHA1
- Do not use encrypt-and-MAC mode
- Increase DH modulus
SSH settings can be configured for gitlab-shell in platform.yaml:
gitlab:
  gitlab-shell:
    config:
      ciphers: [...]
      kexAlgorithms: [...]
      macs: [...]
CI/CD Masked Variables Recommendations
A penetration test conducted on GitLab Runners revealed that using masked variables can enable the impersonation of certain actions.
🌟 Recommendation: Raise awareness among developers and DevOps teams about this issue, and provide guidance to avoid using masked variables for storing sensitive data such as passwords and secrets.
🌟 Recommendation: GitLab officially advises using HashiCorp Vault to manage sensitive information, rather than storing it directly in GitLab CI/CD variables. This approach enhances security and minimizes the risk of accidental exposure.
PostgreSQL Version Recommendation
Starting with GitLab version 18.0 support for PostgreSQL 14 and 15 has been removed. Make sure you are running PostgreSQL 16 before upgrading. Follow the upgrade steps in the official GitLab documentation to ensure compatibility and stability.
Breaking change for Prometheus subchart
With GitLab 18.0 and GitLab chart 9.0, the Prometheus subchart will be updated from 15.3 to 27.3. Along with this update, Prometheus 3 will be shipped by default.
Manual steps are required to perform the upgrade. If you have Alertmanager, Node Exporter or Pushgateway enabled, you will also need to update your Helm values. Please refer to the migration guide for more information.
CI/CD Job Token Recommendations
GitLab announced the removal of “Limit Access from Your Project” setting starting with version 16.0, which is scheduled for removal in version 18.0. In GitLab 16.0 and later, you cannot re-enable this setting after it is disabled in any project. Instead, use the Authorized groups and projects setting to control job token access to your projects.
We recommend the following steps:
Define a Precise Allowlist Populate the allowlist with only the necessary groups and projects. Avoid using broad entries such as “all projects” to maintain strict access control.
Restrict Access Scope Once the allowlist is configured, update the Authorized Groups and Projects setting to: “Only this project and any groups and projects in the allowlist”. This ensures that access is limited to explicitly defined entities.
Enforce Job Token Restrictions Enable the “Enforce job token allowlist” setting across all projects. This prevents the use of the “allow all projects” option, further tightening security and access boundaries.
API rate limitations
GitLab introduced rate limitations to the Projects, Groups and Users API.
When upgrading to 18.0, these rate limits are set to zero and the feature flag is disabled by default, ensuring no disruption to your current workflows. This approach gives administrators complete control - you can choose to enable these limits at your convenience by toggling the feature flag and setting the appropriate rate limits for your installation. In GitLab 18.1, the feature flag has been removed. It means the rate limits you’ve defined before that (unlimited by default) will automatically be used, even if you didn’t enable the feature flag.
From GitLab 18.3, new installations will have the default rate limits (see “Rate limitation details” in the official documentation) applied.
Monitoring
GitLab Performance Monitoring
GitLab comes with its own application performance measuring system, called “GitLab Performance Monitoring”. GitLab Performance Monitoring is available in both the Community and Enterprise editions.
GitLab Performance Monitoring makes it possible to measure a wide variety of statistics including (but not limited to):
- The time it took to complete a transaction (a web request or Sidekiq job).
- The time spent in running SQL queries and rendering HAML views.
- The time spent executing (instrumented) Ruby methods.
- Ruby object allocations and retained objects in particular.
- System statistics such as the process’ memory usage and open file descriptors.
- Ruby garbage collection statistics.
Two types of metrics are collected:
- Transaction specific metrics.
- Sampled metrics, collected at a certain interval in a separate thread.
Transaction Metrics
Transaction metrics are metrics that can be associated with a single transaction. This includes statistics such as the transaction duration, timings of any executed SQL queries, and time spent rendering HAML views. These metrics are collected for every Rack request and Sidekiq job processed.
Sampled Metrics
Sampled metrics are metrics that can’t be associated with a single transaction. Examples include garbage collection statistics and retained Ruby objects. These metrics are collected at a regular interval. This interval is made up out of two parts:
- A user defined interval.
- A randomly generated offset added on top of the interval, the same offset can’t be used twice in a row.
The actual interval can be anywhere between a half of the defined interval and a half above the interval. For example, for a user defined interval of 15 seconds the actual interval can be anywhere between 7.5 and 22.5. The interval is re-generated for every sampling run instead of being generated one time and reused for the duration of the process’ lifetime.
User defined intervals can be specified by means of environment variables. The following environment variables are recognized:
RUBY_SAMPLER_INTERVAL_SECONDSDATABASE_SAMPLER_INTERVAL_SECONDSACTION_CABLE_SAMPLER_INTERVAL_SECONDSPUMA_SAMPLER_INTERVAL_SECONDSTHREADS_SAMPLER_INTERVAL_SECONDSGLOBAL_SEARCH_SAMPLER_INTERVAL_SECONDS
Metrics for supervising health of components
GitLab provides several endpoints to check the health of your system:
Liveness Probe: Checks if the application server is running.
- URL:
http://your-gitlab-instance/-/liveness - Example request:
curl "http://your-gitlab-instance/-/liveness"
- URL:
Readiness Probe: Checks if the GitLab instance is ready to accept traffic.
- URL:
http://your-gitlab-instance/-/readiness - Example request:
curl "http://your-gitlab-instance/-/readiness"
- URL:
Health Check: Provides a basic health check.
- URL:
http://your-gitlab-instance/-/health - Example request:
curl "http://your-gitlab-instance/-/health"
- URL:
GitLab Prometheus metrics
This section discusses the Prometheus metrics endpoint.
Prometheus service is disabled by default on Software Factory deployments.
If required, Prometheus service can be enabled in the helm chart by setting the
value prometheus.install: true.
GitLab supports Prometheus metrics for more detailed monitoring. Prometheus metrics endpoint is enabled by default. This can be changed in the Admin interface:
Enable/Disable Prometheus Metrics:
- Sign in to GitLab as an administrator.
- Go to Admin Area > Settings > Metrics and profiling.
- Enable/Disable the GitLab Prometheus metrics endpoint.
Access Metrics:
- URL:
http://your-gitlab-instance/-/metrics - Example request:
curl "http://your-gitlab-instance/-/metrics" - These metrics include various internal service metrics such as cache operations, CI/CD pipeline creation duration, and database transaction times.
- URL:
A detailed list of all exposed metrics is available in the GitLab Prometheus Metrics section of the official documentation.
GitLab Event Tracking and Service Ping
GitLab includes event tracking to collect usage data that helps improve the product and provide insights into feature adoption. This tracking can be disabled only during deployment by setting the appropriate configuration flags in the Helm chart.
GitLab does not publish a single static “exhaustive list” of all events tracked by Event Tracking because the system is designed to be dynamic and extensible. However, below is an overview of the events that are being tracked.
What Event Tracking Covers
GitLab tracks user interactions and system actions at a granular level, such as:
- Clicking buttons, activating form fields.
- Creating issues, merging merge requests.
- Triggering CI/CD pipelines or webhooks.
Where Definitions Live
Event tracking uses Snowplow and GitLab’s internal instrumentation:
- Frontend: Events are defined in JS/Vue/HAML templates using
data-track-*attributes ortrackEvent()calls. - Backend: Events are triggered via
track_internal_eventand linked to RedisHLL counters and Snowplow events.
- Frontend: Events are defined in JS/Vue/HAML templates using
Events include metadata (category, label, property, value) but do not include source code or customer content. User IDs are pseudonymized for privacy
Lists and Dictionaries
- GitLab provides:
- A Metrics Dictionary and Internal Events Payload Samples showing event schemas and parameters
(e.g.,
event_id,category,label,property,value)
- A Metrics Dictionary and Internal Events Payload Samples showing event schemas and parameters
(e.g.,
More information on Event Tracking can be found in the GitLab documentation under Event Tracking and Internal Event Instrumentation .
By default, our GitLab deployment disables event tracking during installation. As of this version of the document there is no automated method to disable it after installation.
Existing deployments may have Event Tracking enabled, and administrators should verify the settings to ensure compliance with organizational policies. It is recommended to review this configuration after any major GitLab upgrade.
To disable Event Tracking, navigate to the Web UI, go to Admin area > Settings > Metrics > profiling, and uncheck Enable event tracking.
There is no API or configuration file method to disable it post-deployment.
In addition to event tracking, GitLab uses Service Ping, a telemetry mechanism that periodically sends a JSON payload to GitLab Inc.
The data is extensive and dynamic (changes with GitLab versions). GitLab does not publish a static exhaustive list in the official documentation, but they provide some information in the Service Ping Development Guide where an example payload structure is outlined.
This payload includes aggregated, anonymized usage statistics such as:
- Number of users, projects, and groups
- Enabled features (e.g., CI/CD, Issues, Merge Requests)
- Instance-level configuration details (e.g., license type, version)
A complete current list of collected Service Ping data can be downloaded from the GitLab instance’s admin area under Admin area > Settings > Metrics and profiling.
Frequency: Service Ping runs once every 24 hours by default.
Service Ping cannot be disabled. This is by design , and connected to the license, because it provides critical data for:
- License compliance and subscription validation
- Security and upgrade notifications
- Product improvement and capacity planning
Even though the data is anonymized and does not include sensitive information like code or personal user data, its mandatory nature ensures GitLab can maintain accurate metrics for support and development purposes.
More in-depth information on monitoring and metrics collection are available in the GitLab documentation
Logs
GitLab’s log system offers extensive logging and monitoring to help diagnose issues, investigate security incidents, and assess performance across the entire instance. It captures every action in structured log files, recording activity across all components, including performance metrics, errors, and security events. The system supports JSON logging for integration with tools like Elasticsearch and Splunk, organizes logs by service, and uses correlation IDs to trace requests end-to-end. System logs are plain-text and function similarly to audit events.
Logging Architecture Overview
The GitLab logging system:
- Tracks activity across all components in structured log files
- Records performance metrics, errors, and security events
- Produces per-service logs (e.g., Rails, Sidekiq, Gitaly, Registry) in standardized formats
- Supports log levels (DEBUG, INFO, WARN, ERROR, FATAL) with DEBUG as default for most loggers
Log Levels
Each log message in GitLab is assigned a log level that reflects its importance and verbosity. A logger only outputs messages at or above its configured minimum log level, ensuring that only relevant information is emitted. The system supports multiple predefined log levels.
The following log levels are supported:
| Level | Name |
|---|---|
| 0 | DEBUG |
| 1 | INFO |
| 2 | WARN |
| 3 | ERROR |
| 4 | FATAL |
| 5 | UNKNOWN |
All log messages are set to DEBUG by default.
GitLab services logs
This section summarizes how to access logs for GitLab installations, focusing on Helm chart installations and briefly covering Linux package installations. It highlights where logs are located, how to retrieve them, and how to filter structured logs.
Logs in Helm Chart Installations
GitLab components deployed via Helm charts output logs to stdout. These logs can be viewed using:
kubectl logs- Log files under
/var/log/gitlab(only for the lifetime of the pod)
Pods with Structured Logs (Subcomponent Filtering)
Some GitLab pods support structured logs with a subcomponent field.
You can filter these logs using jq:
# Webservice pod logs (Rails application)
kubectl logs -l app=webservice -c webservice | jq 'select(."subcomponent"=="<subcomponent-key>")'

# Sidekiq pod logs (background jobs)
kubectl logs -l app=sidekiq | jq 'select(."subcomponent"=="<subcomponent-key>")'
Logs for Other Pods
For pods that do not use structured logging, logs can be retrieved directly.
Finding pod selectors:
# List all unique app labels in use
kubectl get pods -o jsonpath='{range .items[*]}{.metadata.labels.app}{"\n"}{end}' | grep -v '^$' | sort | uniq
Getting logs:
# For pods with app labels
kubectl logs -l app=<pod-selector>

# For specific pods (when app labels aren't available)
kubectl get pods
kubectl logs <pod-name>
Logs are also available inside each pod for the lifetime of the pod at /var/log/gitlab.
Logs for Linux Package Installations
Although SWaaP does not provide GitLab as Linux packages, the document notes that on such installations logs are typically found in:
/var/log/gitlab/gitlab-rails/var/log/gitlab/<service-name>
Exact locations depend on the specific service.
Detailed information on GitLab Logs is available on the official documentation .