version v7.2.
For up-to-date documentation, see the
latest version.
Operations Guide
14 minute read
Referenced documentation
| Document reference | Document Name |
|---|---|
| TASD | Technical Architecture and Security Document of SWaaP |
| LLD-Xray | Low level design of Xray component |
Introduction
The JFrog-Xray component is part of Software Factory as a Package (SWaaP)
The component is in charge of scanning artifacts and dependencies for vulnerabilities, license compliance, and security issues. It provides detailed insights into open-source dependencies and helps identify risks early in the development lifecycle. It also allows users to automate security policies, continuously monitor their software components, and integrate with CI/CD pipelines for proactive risk management.
Learn more about it in LLD-Xray and in TASD .
Billing and Onboarding
Xray component is part of Artifactory Enterprise and uses Artifactory IAM.
Xray and Artifactory, together with GitLab and SonarQube are part of the DevSecOps offer in the Software Factory. To have access to this component users should be onboarded to the offer DevSecOps.
We are currently providing an integration for the components in the DevSecOps offer (Xray/Artifactory/GitLab/SonarQube) and Offer Management on the TDP platforms to cover the billing. The rest of the platforms will have their own onboarding and billing process.
Billing & Onboarding on TDP
The onboarding for Xray is managed via the PostIT request for Get access to Software Solutions , by selecting DevSecOps as the offering that includes access to the component.
To onboard a project in Artifactory, a repository must be created for it and the correct permissions must be given in order to have access to Xray features (see LLD-Xray §6.2.4 User management)
Billing & Onboarding on RTDP
To have access to this component, users should be onboarded to the offer offername.
Billing & Onboarding on CASTLE
To have access to this component, users should be onboarded to the offer offername.
Component Deployment and Configuration
Requirements & Pre-requisite
All associated ECOL prerequisites are detailed in the LLD-Xray §4.2 prerequisites
Configuration
Setting Helm Values
Mandatory GitLab values are described in the SWaaP Readme - Helm values .
There’s also a list of required and optional ConfigMaps that are needed. These are described in the Xray package readme document
Configuring Kubernetes Secrets
The required Xray secrets and how they are created is described in the SWaaP Readme - Xray secrets .
Note that, based on the Helm values you provide, additional Kubernetes secret and configmaps may also be required. Please check the official documentation for further information.
Deployment & Update Procedure
Xray deployments and upgrades are automated using Flux , a GitOps framework.
Mandatory Always check the official Xray upgrade documentation
Xray version 3.70.0 and later includes RabbitMQ version 3.11.x later. An upgrade to Rabbit MQ 3.11.x requires feature flags to be enabled. More on this on the RabbitMQ documentation
Still, the upgrade via helm values is not advisable in a linkerd enabled K8S cluster as the pre-upgrade hook that enables feature flags in RabbitMQ before the upgrade to version 3.11.x and later will result in a helm upgrade failure . Make sure the following helm values as set as per bellow:
rabbitmq.migration.enabled=false
rabbitmq.rabbitmqUpgradeReady=true
In order to have a succesfull upgrade, we strongly recommend to perform the following manual steps as pre-upgrade steps:
- Step 1: make sure RabbitMQ feature flags are enabled by issuing the following command:
kubectl exec -it xray-rabbitmq-0 -c rabbitmq -n xray -- rabbitmqctl list_feature_flags
The result should look simillar to this:
Listing feature flags ...
name    state
classic_mirrored_queue_version  enabled
classic_queue_type_delivery_support     enabled
direct_exchange_routing_v2      enabled
drop_unroutable_metric  enabled
empty_basic_get_metric  enabled
feature_flags_v2        enabled
implicit_default_bindings       enabled
listener_records_in_ets enabled
maintenance_mode_status enabled
quorum_queue    enabled
restart_streams disabled
stream_queue    enabled
stream_sac_coordinator_unblock_group    disabled
stream_single_active_consumer   enabled
tracking_records_in_ets enabled
user_limits     enabled
virtual_host_metadata   enabled
- Step 2: enable RabbitMQ feature flags by issuing the following command:
kubectl exec -it xray-rabbitmq-0 -c rabbitmq -n xray -- rabbitmqctl enable_feature_flag all
The deployment and update procedures are described in the SWaaP Readme - Quick start section .
Here’s an example of a release YAML file
apiVersion: helm.toolkit.fluxcd.io/v2beta1
kind: HelmRelease
metadata:
  name: xray
spec:
  releaseName: xray
  chart:
    spec:
      chart: xray
      version: 103.118.14
      sourceRef:
        kind: HelmRepository
        name: jfrog
  install:
    crds: Skip
  upgrade:
    crds: Skip
  interval: 10m
  timeout: 20m
  valuesFrom:
    - kind: ConfigMap
      name: helm-common-values
      valuesKey: common.yaml
    - kind: ConfigMap
      name: helm-sizing-values
      valuesKey: sizing.yaml
    - kind: ConfigMap
      name: helm-platform-values
      valuesKey: platform.yaml
    - kind: Secret
      name: helm-secret-values
      valuesKey: secret.yaml
    - kind: ConfigMap
      name: helm-extra-values
      valuesKey: values.yaml
      optional: true
apiVersion: source.toolkit.fluxcd.io/v1beta2
kind: HelmRepository
metadata:
  name: jfrog
spec:
  interval: 30m
  url: ${helmRepositoryUrl:="https://charts.jfrog.io"}
Settings
Define mandatory configuration variables and values.
The HelmRelease object requires 3 (three) ConfigMap:
ConfigMaps automatically generated from the files located in the
xray/valuesdirectory:- kind: ConfigMap name: helm-common-values valuesKey: common.yamlConfigMaps the user needs to provide:
- kind: ConfigMap
  name: helm-sizing-values
  valuesKey: sizing.yaml
- kind: ConfigMap
  name: helm-platform-values
  valuesKey: platform.yaml
An optional ConfigMap ([
optional: true][[helmrelease]]) can also be provided. This can be beneficial in certain scenarios, such as when configuring the reference Kustomization resource from the Flux admin repository. This allows the Flux administrator to specify Helm values that they do not necessarily want to add to the reference repository.- kind: ConfigMap name: helm-extra-values valuesKey: values.yaml optional: true
PostgreSQL configuration YAML file, e.g. pg.yaml
| Key | Type | Default | Description |
|---|---|---|---|
| auth.existingSecret | String | xray-database-creds | Existing secret for authentication |
| auth.database | String | xray | Database for authentication |
| auth.secretKeys.adminPasswordKey | String | db-password | Name of key in existing secret to use for PostgreSQL credentials. Only used when auth.existingSecret is set. |
| primary.persistence.size | String | 10Gi | Size of the primary persistence volume |
Xray platform setup, installation and deployment YAML file, e.g. platform.yaml
| Key | Type | Default | Description |
|---|---|---|---|
| serviceAccount.create | Boolean | false | Specify whether to create a service account |
| serviceAccount.name | String | ${serviceAccountName} | Name of the service account |
| database.type | String | PostgreSQL | Type of the database |
| database.driver | String | org.postgresql.Driver | Driver used for the database connection |
| database.secrets.user.name | String | xray-database-creds | Name of the secret containing the database username |
| database.secrets.user.key | String | db-user | Key of the database username in the secret |
| database.secrets.password.name | String | xray-database-creds | Name of the secret containing the database password |
| database.secrets.password.key | String | db-password | Key of the database password in the secret |
| database.secrets.url.name | String | xray-database-creds | Name of the secret containing the database URL |
| database.secrets.url.key | String | db-url | Key of the database URL in the secret |
| database.secrets.actualUsername.name | String | xray-database-creds | Name of the secret containing the actual username |
| database.secrets.actualUsername.key | String | db-actualUsername | Key of the actual username in the secret |
| rabbitmq.serviceAccount.create | Boolean | false | Specify whether to create a service account for RabbitMQ |
| rabbitmq.serviceAccount.name | String | ${serviceAccountName} | Name of the service account for RabbitMQ |
| xray.jfrogUrl | String | https://${artifactoryName:="artifactory.example.com"} | URL of the Artifactory instance for Xray |
Sizing configuration file for components in Xray deployment, e.g. sizing.yaml
| Key | Type | Default | Description |
|---|---|---|---|
| replicaCount | Integer | 2 | Number of replicas (only when autoscaling is not enabled) |
| common.persistence.size | String | 500Gi | Size of persistence storage for common component |
| rabbitmq.replicaCount | Integer | 1 | Number of replicas for RabbitMQ |
| rabbitmq.schedulers | String | “1” | Number of RabbitMQ schedulers |
| rabbitmq.vm_memory_high_watermark_absolute | String | 700MB | Absolute watermark for RabbitMQ VM memory usage |
| rabbitmq.resources.requests.memory | String | “512Mi” | Requested memory for RabbitMQ |
| rabbitmq.resources.requests.cpu | String | “500m” | Requested CPU for RabbitMQ |
| rabbitmq.resources.limits.memory | String | “1Gi” | Memory limit for RabbitMQ |
| rabbitmq.resources.limits.cpu | String | “1” | CPU limit for RabbitMQ |
| rabbitmq.persistence.enabled | Boolean | true | Enable persistence for RabbitMQ |
| rabbitmq.persistence.size | String | 20Gi | Size of persistence storage for RabbitMQ |
| server.resources.requests.memory | String | “300Mi” | Requested memory for server component |
| server.resources.requests.cpu | String | “100m” | Requested CPU for server component |
| server.resources.limits.memory | String | “4Gi” | Memory limit for server component |
| server.resources.limits.cpu | String | “3” | CPU limit for server component |
| analysis.resources.requests.memory | String | “300Mi” | Requested memory for analysis component |
| analysis.resources.requests.cpu | String | “50m” | Requested CPU for analysis component |
| analysis.resources.limits.memory | String | “4Gi” | Memory limit for analysis component |
| analysis.resources.limits.cpu | String | “3” | CPU limit for analysis component |
| persist.resources.requests.memory | String | “300Mi” | Requested memory for persist component |
| persist.resources.requests.cpu | String | “50m” | Requested CPU for persist component |
| persist.resources.limits.memory | String | “4Gi” | Memory limit for persist component |
| persist.resources.limits.cpu | String | “3” | CPU limit for persist component |
| indexer.resources.requests.memory | String | “300Mi” | Requested memory for indexer component |
| indexer.resources.requests.cpu | String | “50m” | Requested CPU for indexer component |
| indexer.resources.limits.memory | String | “4Gi” | Memory limit for indexer component |
| indexer.resources.limits.cpu | String | “4” | CPU limit for indexer component |
Note: Please note that the values for memory, CPU, xms, and xmx are placeholders and can be customized as per your requirements.
Functional Configuration
---
## In order to allow helm install upgrade on existing Xray release
unifiedUpgradeAllowed: true

global:
  imageRegistry: ${imageRepositoryUrl:=releases-docker.jfrog.io}

initContainerImage: ${imageRepositoryUrl:=releases-docker.jfrog.io}/ubi9/ubi-minimal:9.3.1361.1699548032

xray:
  name: xray
  labels: {}
  persistence:
    mountPath: /var/opt/jfrog/xray

  ## If false, all service console logs will not redirect to a common console.log
  consoleLog: false

## Role Based Access
## Ref: https://kubernetes.io/docs/admin/authorization/rbac/
rbac:
  create: false

## Apply horizontal pod auto scaling on Xray pods
## Ref: https://kubernetes.io/docs/tasks/run-application/horizontal-pod-autoscale/
autoscaling:
  enabled: true
  minReplicas: 1
  maxReplicas: 3
  targetCPUUtilizationPercentage: 70
  targetMemoryUtilizationPercentage: 90

## Service Account
## Ref: https://kubernetes.io/docs/admin/service-accounts-admin/
##
serviceAccount:
  create: false

# PostgreSQL
## Configuration values for the postgresql dependency
## ref: https://github.com/kubernetes/charts/blob/master/stable/postgresql/README.md
##
postgresql:
  enabled: false

# RabbitMQ
## Configuration values for the rabbitmq dependency
## ref: https://github.com/bitnami/charts/blob/master/bitnami/rabbitmq/README.md
##
rabbitmq:
  clustering:
    forceBoot: true
  serviceAccount:
    create: false
  enabled: true
  replicaCount: 1
  rbac:
    create: false
  # image:
  #   registry: releases-docker.jfrog.io
  #   repository: bitnami/rabbitmq
  auth:
    erlangCookie: XRAYRABBITMQCLUSTER
    # existingErlangSecret: <name-of-existing-secret>
  maxAvailableSchedulers: null
  onlineSchedulers: null
  ## Additional environment variables to set
  ## ref: https://github.com/bitnami/charts/tree/master/bitnami/rabbitmq#adding-extra-environment-variables
  extraEnvVars:
    - name: RABBITMQ_SERVER_ADDITIONAL_ERL_ARGS
      value: "+S 2:2 +sbwt none +sbwtdcpu none +sbwtdio none"
  service:
    port: 5672
  persistence:
    enabled: true
    accessMode: ReadWriteOnce
    size: 20Gi

# Common Xray settings
common:
  ## Note that by default we use appVersion to get image tag
  # xrayVersion:
  # xrayUserId: 1117
  # xrayGroupId: 1117

  # Xray configuration to be written to xray_config.yaml
  xrayConfig:
    stdOutEnabled: true
    indexAllBuilds: false
    support-router: true

  persistence:
    enabled: true
    ## A manually managed Persistent Volume and Claim
    ## Requires persistence.enabled: true
    ## If defined, PVC must be created manually before volume will be bound
    # existingClaim:

    accessMode: ReadWriteOnce
    ## Container storage limit if persistence.enabled: false
    ## Otherwise PVC size
    ## server data Persistent Volume Storage Class
    ## If defined, storageClassName: <storageClass>
    ## If set to "-", storageClassName: "", which disables dynamic provisioning
    ## If undefined (the default) or set to null, no storageClassName spec is
    ##   set, choosing the default provisioner.  (gp2 on AWS, standard on
    ##   GKE, AWS & OpenStack)
    ##
    # storageClass: "-"

server:
  name: xray-server
  ## Note that by default we use appVersion to get image tag/version
  # image:
  #   registry: releases-docker.jfrog.io
  #   repository: jfrog/xray-server
  # tag:
  internalPort: 8000
  externalPort: 8000
  annotations:
    linkerd.io/inject: disabled

analysis:
  name: xray-analysis
  ## Note that by default we use appVersion to get image tag/version
  # image:
  #   registry: releases-docker.jfrog.io
  #   repository: jfrog/xray-analysis
  # tag:
  internalPort: 7000
  externalPort: 7000

indexer:
  name: xray-indexer
  ## Note that by default we use appVersion to get image tag/version
  # image:
  #   registry: releases-docker.jfrog.io
  #   repository: jfrog/xray-indexer
  # tag:
  internalPort: 7002
  externalPort: 7002

persist:
  name: xray-persist
  ## Note that by default we use appVersion to get image tag/version
  # image:
  #   registry: releases-docker.jfrog.io
  #   repository: jfrog/xray-persist
  # tag:
  internalPort: 7003
  externalPort: 7003

# this parameter is handled by KaaS directly in their clusters
quota:
  enabled: false
Monitoring
This section of this document presents practical monitoring and logging guidance on how to monitor JFrog Xray health and performance using its metrics endpoints and platform logs. The main objective of the monitoring section is to provide the key sources and evidences required to detect scan delays, resource pressure, and API/pipeline issue.
Monitoring JFrog Xray is essential for the following reasons
- Keeping vulnerability and license scanning reliable avoiding to provide delayed analysis
- Preventing outages due to disk, DB pool, or memory pressure
- Detecting backpressure in DB sync and analysis pipelines
- Proving availability and performance of the Xray API for CI/CD integrations
Transaction Metrics
“Transaction” in the context of metrics means per request / per user action.
In Xray, the most reliable transaction-level sources are the standardized platform logs:
Request logs (
*-request.log) A pipe-separated record for each HTTP request (including gRPC) to a microservice, with consistent fields:- Time correlation traceability
- Timestamp
- Trace ID is designed to help correlate a single request across services through the request logs and the service logs.
- Client network context
- Remote address
- User agent
- User / identity
- username (or
anonymous)
- username (or
- Request definition
- Method
- URL (relative path)
- Outcome
- Return status (HTTP status code)
- Payload / size
- request content length
- response content length
- Performance
- duration (ms)
More information about the structure and fields can be found in the guide related to Request Log .
- Time correlation traceability
Router request log (
router-request.log) The Router records a JSON-formatted access log for every request it handles including internal service-to-service calls. This makes it especially useful for tracing and troubleshooting end-to-end flows across multiple components. For example an example of tracing might be according to this flow UI → Router → Xray → other services. To get more information about examples for tracing, check the guide related to Router Request Log .Recommended transaction metrics you can derive via log analytics queries (or log-to-metrics pipelines):
Xray API request rate (RPS): count of Xray-related requests per time window Filter by request path prefix like
/xray/api/in*-request.logand/orrouter-request.log.- Error rate: ratio of non-2xx (or specifically 5xx) return statuses.
- Latency: percentiles over
Request Duration(P50, P95, P99). - Top callers: group by
Usernameand/orRemote Addressand/orUser Agent.
Sampled Metrics
“Sampled” here means periodic system/service metrics scraped on an interval (dashboards + alerting).
Xray metrics endpoint
JFrog documents retrieving Xray metrics using an OpenMetrics-style endpoint:
- Endpoint:
GET /xray/api/v1/metrics - Security: requires an admin user and is available only for on-prem customers
- Format: Prometheus/OpenMetrics text exposition
Example:
curl -H "Authorization: Bearer TOKEN" \
  http://{jfrog_platform_url}/xray/api/v1/metrics
High-value examples you’ll commonly alert on (directly from the endpoint output):
Disk
app_disk_used_bytesapp_disk_free_bytes
Database pool
db_connection_pool_in_use_totaldb_connection_pool_idle_total
Host + process
sys_load_1,sys_load_5,sys_load_15sys_memory_used_bytes,sys_memory_free_bytesgo_memstats_*(heap/GC/process stats)
Xray pipeline health (Xray-specific)
jfxr_db_sync_started_before_secondsjfxr_db_sync_running_totaljfxr_db_sync_ended_persist_before_secondsjfxr_db_sync_ended_analyze_before_secondsjfxr_data_artifacts_total{package_type="..."}jfxr_data_components_total{package_type="..."}jfxr_performance_server_up_time_seconds
More information about the metrics can be found in the guide related to Xray Metrics (REST API) .
Enabling Open Metrics
In addition to the endpoint itself, JFrog documents an Open Metrics feature flag
in system.yaml to find variable (openMetrics.enabled: true) for metrics
exposure/collection in the platform.
To enable metrics in Xray, make the following configuration change to the Xray System YAML:
openMetrics:
    enabled: true
For more information on how to enable metrics in Xray, check the guide related to Xray System YAML .
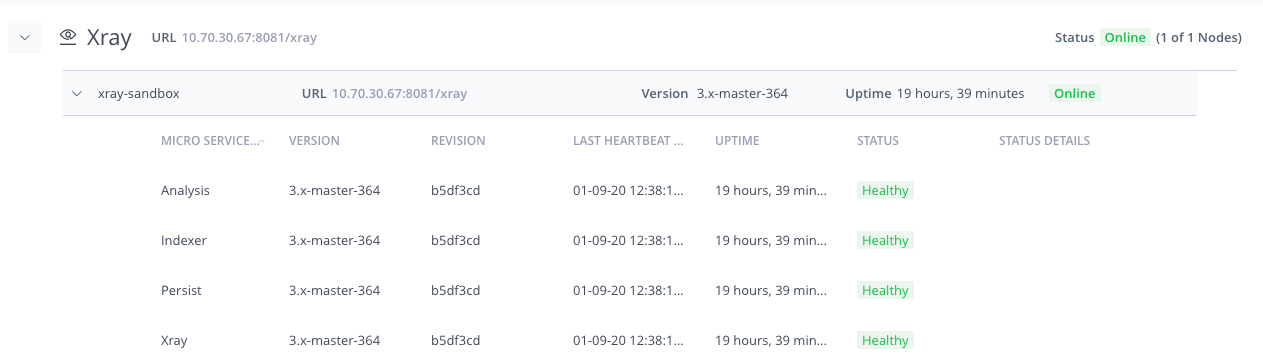
Metrics for supervising health of components
A practical “health supervision” approach is to track availability, saturation, and pipeline freshness:
Core health indicators (recommended):
Availability
Use Xray “ping” as a simple API health check:
GET /xray/api/v1/system/ping→{"status":"pong"}.For more information about sending ping request, check the guide related to Ping Request (Xray) .
Disk pressure
- Alert when
app_disk_free_bytesis low or dropping quickly; confirm with the settingapp_disk_used_bytes.
- Alert when
Database saturation
- Alert when
db_connection_pool_in_use_totalrises toward your max and the value for the variabledb_connection_pool_idle_totalstays near 0.
- Alert when
DB sync + analysis freshness (the “Xray heartbeat”)
- Alert if
jfxr_db_sync_started_before_secondsgrows continuously based on no recent sync start. - Alert if
jfxr_db_sync_running_totalstays high (sync running unusually long). - Alert when value grows unusually for one of these two variables
jfxr_db_sync_ended_persist_before_secondsjfxr_db_sync_ended_analyze_before_seconds
- Alert if
Coverage / growth signals
- Track
jfxr_data_artifacts_totalandjfxr_data_components_totalbypackage_typeto understand scan volume and whether indexing/scan coverage is growing as expected.
- Track
Monitor Xray Microservices
Administration / Platform
Xray includes the following microservices:
Indexer
Responsible for the indexing process, including:
- Recursively extracting artifacts and builds
- Collecting artifact metadata from accompanying files
- Building an artifact components graph representation
Persist
Responsibilities include:
- Matching the given components graph with the public component information
- Completing component naming
- Storing the data in the relevant databases (graph data in PostgreSQL and component metadata in MongoDB)
Policy Enforcer
Responsible for generating violations by matching analysis data with Xray Watches and Policies.
Analysis
Responsible for enriching component metadata such as vulnerabilities, licenses, and versions.
Server
Responsibilities include:
- Generating violations by matching analysis data with watches and policies
- Hosting the API and UI endpoints
- Running scheduled jobs
Xray Metrics
Administration / Platform
The Xray Metrics REST API returns the following metrics:
| Metric | Description |
|---|---|
jfxr_db_sync_started_before_seconds | Seconds that passed since the last Xray DB sync started running. |
jfxr_db_sync_running_total | DB sync total running time. |
jfxr_db_sync_ended_persist_before_seconds | Seconds that passed since completed persisting new updates to the database. |
jfxr_db_sync_ended_analyze_before_seconds | Seconds that passed since DB sync completed sending all impact analysis messages. |
jfxr_data_artifacts_total | Total number of Xray scanned artifacts by package type. Note: Package type is a label package_type. |
jfxr_data_components_total | Total number of Xray scanned components by package type. Note: Package type is a label package_type. |
jfxr_performance_server_up_time_seconds | Seconds that passed since Xray server has started on the particular node. |
Xray Metrics Logs
The artifactory_metrics.log will contain system metrics such as:
- Total disk space used
- Total disk space free
- Time CPU is used by the process
- JVM available memory
- JVM number of processors
- DB number of active, idle, max, and min connections
- HTTP number of available, leased, pending, and max connections
- Xray DB sync running time
- Xray total number of scanned artifacts and components
- Xray server start time on a node
The artifactory_metrics_events.log will contain deduplicated metrics related to an event,
such as a GC (Garbage Collection) run.
Metrics for Supervising Health of Components
Business Metrics
Xray provides a convenient and up-to-date self-descriptive API that can be used by various tools/frameworks to automate the creation of REST calls. Xray REST APIs
Official documentation for Monitoring and Logging (Xray-focused)
- Request Log
- Router Request Log
- Xray Metrics (REST API)
- Artifactory Metrics
- Xray System YAML
- Ping Request (Xray)
- Log Files Location and Naming
- View Log Files from the UI
- Log Analytics
- Send Logs to Syslog
- Configure the logback library
- Configure syslog on your machine
- Audit Trail Log
- Live Logs