version v7.2.
For up-to-date documentation, see the
latest version.
JFrog Xray usage
4 minute read
Welcome to the JFrog Xray tutorial, you can find a detailed guide presenting the main features of Xray.
We will walk you through the steps to :
manage project policies & watches
install and connect the JFrog extension in Visual Studio Code
scan locally with Xray
Manage Policies & watches at Project Level
Create a Project-Level Policy
To ensure security governance applies strictly to your team’s application, you can create customized Policies that live at the JFrog Project scope.
Follow these steps to create a policy in the JFrog Platform UI:
- Log in to the JFrog Platform UI.
- In the top navigation bar, click on the Project Selector (the dropdown next to the global search bar) and select your specific project.
- In the sidebar menu, navigate to Xray > Watches & Policies > Policies .
- Click New Policy.
- Choose the policy type based on what you want to evaluate: Security, License, or Operational Risk. (please find more details on the Xray tool page )
- Provide a descriptive Name and Description for your policy.
- Click New Rule to define the policy conditions:
- Criteria: Define what triggers the rule (e.g., Minimum Severity = High, specific CVSS Score, or Banned License types).
- Actions: Select what happens when a violation occurs (e.g., Report violation, Trigger webhook, Notify via email, or Fail the build).
- Click Save on the rule configuration pane, and then click Create to finalize and save the policy.
A newly created policy will not actively scan resources on its own. To enforce this policy, you must assign it to a Watch and specify which repositories or builds it should target within your project. Please follow the below guide to do so.
Create a Project-Level Watch
A Policy does nothing on its own until it is applied to specific resources (like repositories, builds, or release bundles). You do this by creating a Watch.
Follow these steps to create a Watch and assign your policy to it:
- Ensure you are still within your specific project scope using the Project Selector in the top navigation bar.
- In the sidebar menu, navigate to Xray > Watches & Policies > Watches .
- Click New Watch.
- Provide a descriptive Name and Description for your Watch.
- In the Manage Resources tab, add the resource type you want and select the resources within it.
- Switch to the Assigned Policies tab and click Manage Policies.
- Find and select the project-level Policy you created in the previous steps, then click Save.
- Finally, click Create to finalize and activate the Watch.
By default, the Watch will automatically monitor any new artifacts uploaded or builds published to the selected resources. If you want to scan artifacts that are already in your repositories, click on your newly created Watch in the list and select Apply on Existing Content (or the manual trigger icon) to scan them retroactively.
Scan your code with JFrog Extension
Install and Connect JFrog Extension
To install the JFrog extension in VSCode, follow these steps:
- In VSCode select the extensions icon in the Activity Bar on the side of the window
or by pressing
Ctrl+Shift+X. - Search for “JFrog” and select the Install button next to the JFrog extension.
- Once the installation is complete, you will see a JFrog icon in the Activity Bar.
- Provide your JFrog platform URL and SSO credentials to connect the extension to your JFrog account.
- Follow the instructions in the extension to configure your settings and start using Xray’s features.
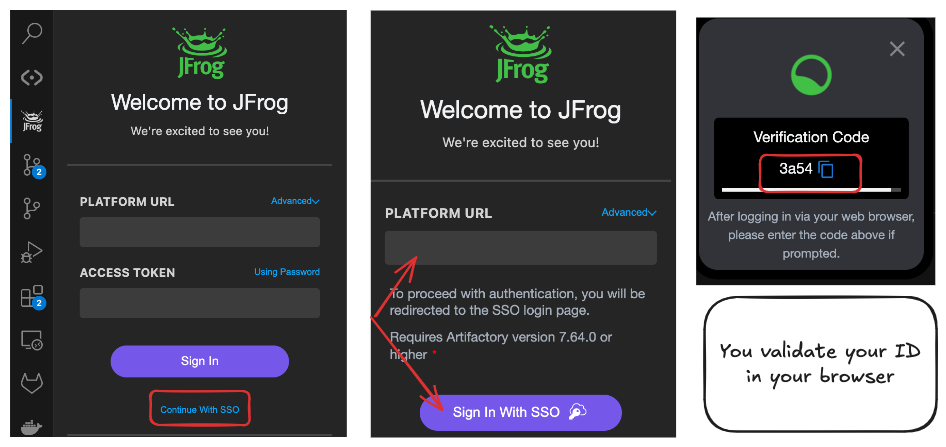
Scan Locally with JFrog IDE & Xray
Open the command palette by pressing Ctrl+Shift+P and type “JFrog: Xray Scan”:
The results will be displayed in the JFrog pane, showing any security vulnerabilities or license compliance issues detected in your dependencies.
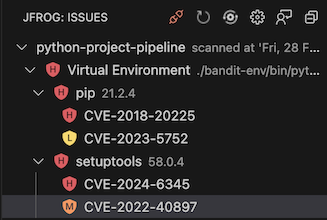
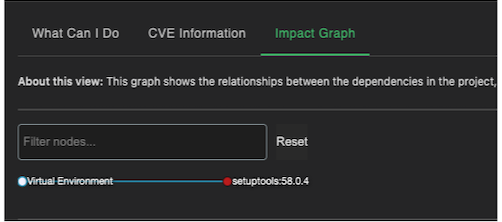
When selecting a vulnerability, you can view detailed information in the JFrog pane:
- Remediation steps in
What Can I Dotabs to help you address the issue
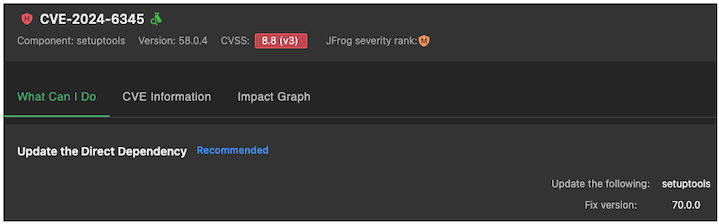
- Detailed information about the CVE in
CVE Informationtab to understand the nature and severity of the vulnerability
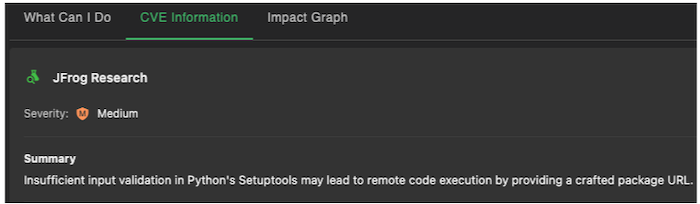
- relationships and dependency in the
Impact Analysistab to understand how the vulnerability affects your project
For more information, refer to the official JFrog how to .