version v7.2.
For up-to-date documentation, see the
latest version.
Troubleshooting Guide
6 minute read
Check the logs
To solve many problems, the first step is reading the logs to find the relevant error message. To do this, follow these steps:
Console logs
In order to view debug logs, which contain extra information, select the dropdown at the top that says “Default levels” and select “Verbose”.
 VSCode
cmd+shift+Pfor MacOS orctrlshift+Pfor Windows
Search for “Developer: Toggle Developer Tools” and select it
This will open the Chrome DevTools window
Select the
ConsoletabRead the console logs
 JetBrains
The logs for the plugin can be found by selecting “Help” > “Show Log in Explorer/Finder”. The most recent logs are found at the bottom of the file.
Make sure to open the file that contains “idea.log”
Download the latest version
To download the latest version of the extension, visit this page . Follow the installation instructions provided on “Getting Started” to update to the latest version.
Initialization Issues
If the extension fails to start properly, no model will be preloaded, as illustrated in the screenshot below.
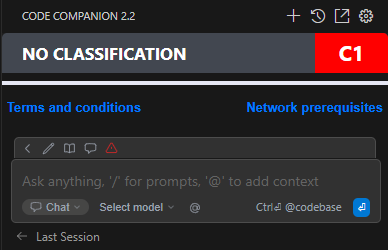
In this situation, please try the following procedures.
Corrupted configuration files
If the extension is not starting correctly,
you can try cleaning up the .continue folder in your home directory.
Sometimes stale files or configurations can prevent the extension from initializing properly.
Please follow the following steps to clean up the .continue folder
Close your IDE: Ensure that your IDE (such as VSCode or JetBrains IDE) is closed before performing the cleanup.
Locate the
.continuefolder: This folder is located in your home directory. You can find it using your file explorer or terminal.- Mac/Linux:
~/.continue - Windows:
C:\Users\<YourUsername>\.continue
- Mac/Linux:
Delete the folder: Remove the
.continuefolder and all its contents.Restart your IDE: Reopen your IDE and try reinitializing the extension. The necessary files and configurations will be recreated upon startup.
This cleanup can resolve issues related to corrupted files
or misconfigurations within the .continue folder,
ensuring that the extension starts correctly.
JetBrains Packaging Issues
In JetBrains, there are a few known issues that you might encounter:
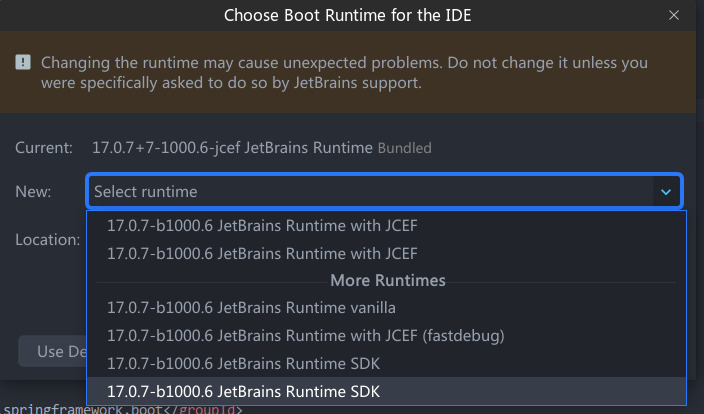
- Java Runtime: An error message may appear indicating that JCEF
(Java Chromium Embedded Framework) is not supported.
- Workaround: try to change the JRE with a JCEF flavored version, see this resource .
- Security Restrictions: The extension might not be able to start
“continue-binary.exe” due to security restrictions, as indicated in the logs.
- Workaround : change value idea.plugins.path to a subfolder of myapp.
These issues will be resolved in the next future with the proper packaging of the extension in the software installation center.
JetBrains Freeze Issues
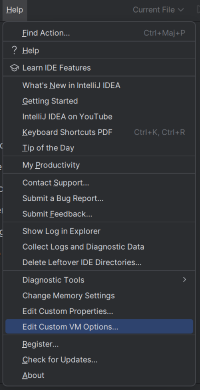
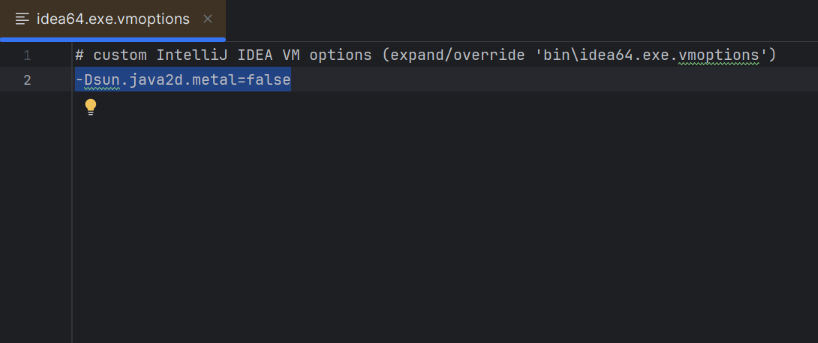
- JetBrains version: Starting with JetBrains IDE version 2025.1, you might encounter Freeze Issues.
- Workaround: Add
-Dsun.java2d.metal=falsetoHelp|Edit custom VM optionsand restart the IDE.
- Workaround: Add
JetBrains UI issues
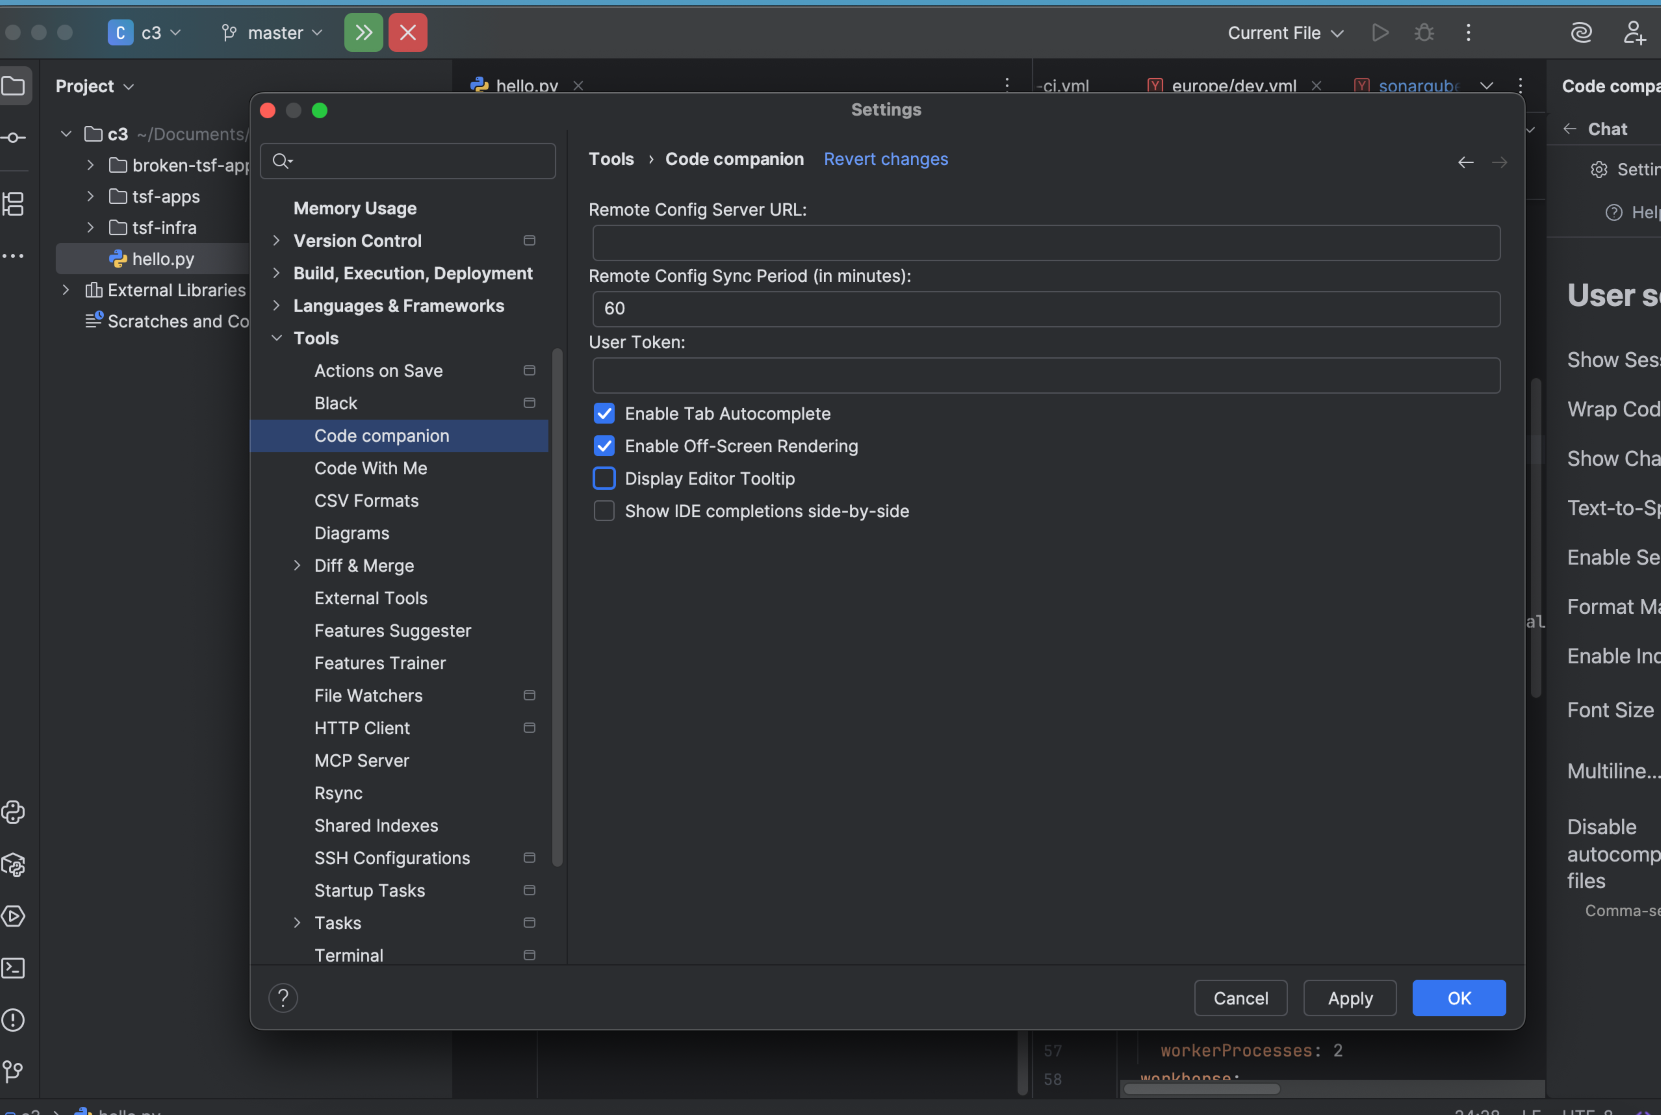
- Visual glitches may appear when scrolling if the Edit + Chat button is pinned at the top.
- Workaround: Settings -> Tools -> Code Companion -> Disable “Display Editor Tooltip”
Networking Issues
You can test the connectivity by accessing the following URLs from your internet browser.
You should have a OK response.
- Navigate to https://code-companion.tgs.cloud.thales/health
VS Code Proxy Settings
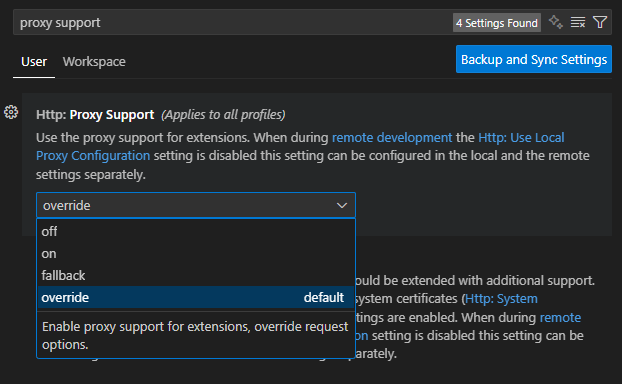
If you are using VS Code and require requests to be made through a proxy, you are likely already set up through VS Code’s Proxy Server Support .
To double-check that this is enabled, use cmd/ctrl + , to open settings and search for “Proxy
Support”. Unless it is set to “off”, then VS Code is responsible for making the request to the
proxy.
JetBrains Proxy Settings
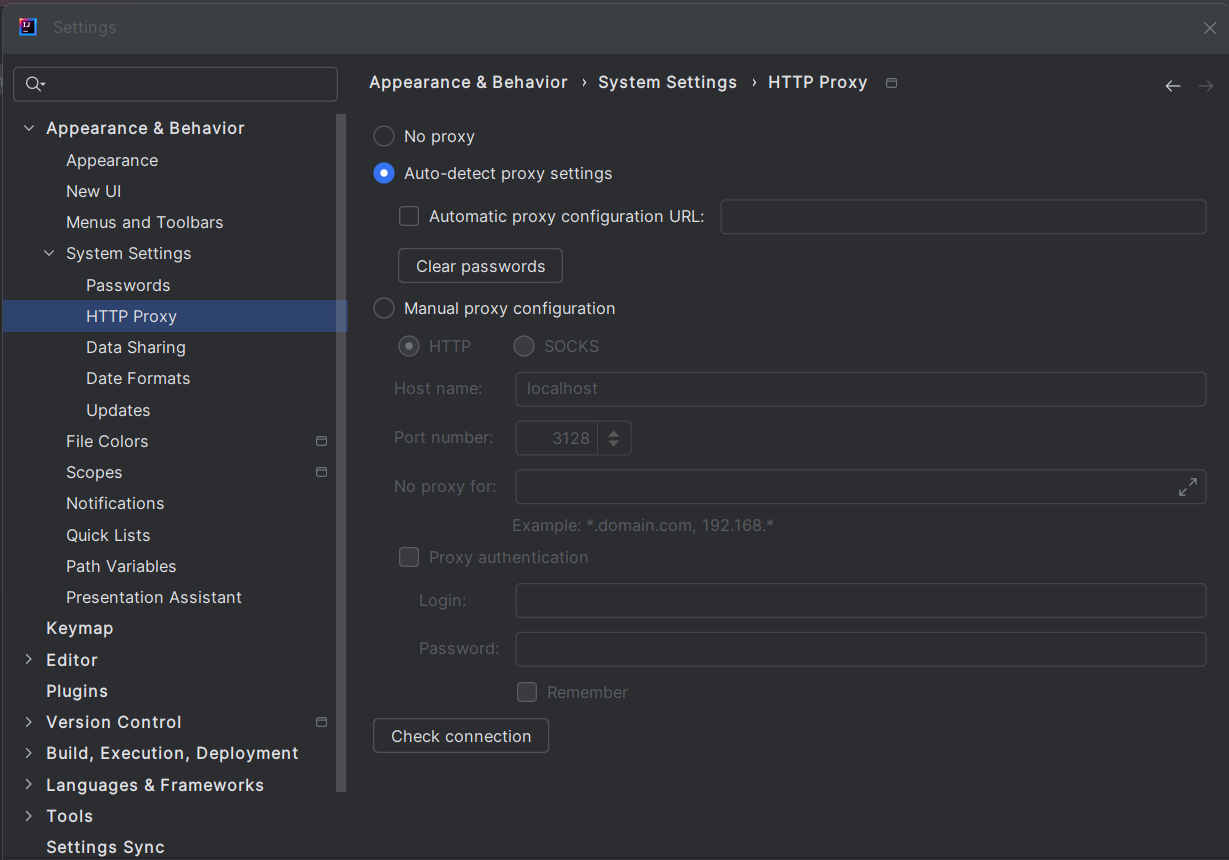
If you are using an IDE from the JetBrains suite and require requests to be made through a proxy, you are likely already set up through JetBrains' Proxy Server Support .
To double-check that this is enabled, you can open settings by selecting “File” > “Settings” > “System Settings” > “HTTP Proxy” and switching it to “auto-detect”.
Also you can check the connection with the correct URLs for your current extension data sensitivity.
Empty response from Code Companion
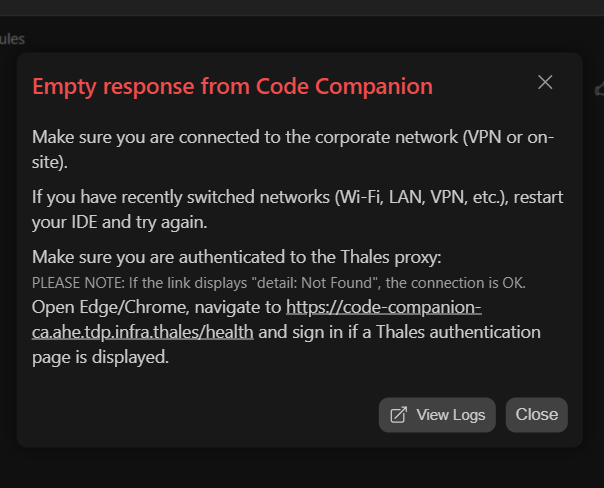
- If you are not connected to corporate network, you might get an empty response from Code Companion.
- You will get a message inviting you to authenticate to the Thales proxy, like below:
- Navigate to the URL that matches the data sensitivity of your current extension.
- If a Thales authentication page is displayed, sign in.
- If you have a page showing “OK”, then go back to Code Companion for first usage
Some tips to avoid empty responses from Code Companion:
- Make sure you are connected to corporate network.
- Each time you are switching networks (Wifi, LAN, VPN…), you will have to restart your IDE & re-apply the procedure above.
502 Bad Gateway
If you’re receiving the error message “502 Bad Gateway” when trying to use Code Companion, make sure you don’t override your system proxy with:
- environment variables HTTP_PROXY and HTTPS_PROXY
- proxy configuration in your IDE
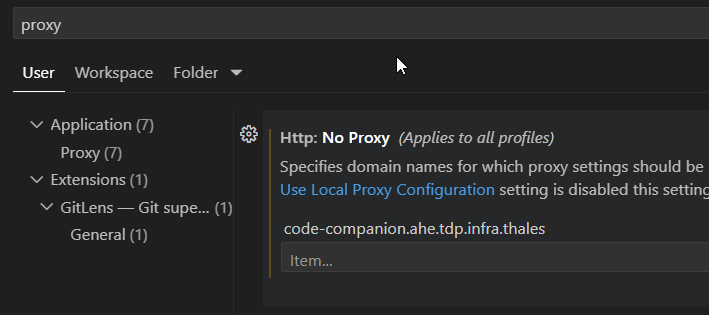
If you want to keep these settings, you can also ignore the proxy for code companion:
For
VSCode
:
- Add
code-companion.genai-pltfmc2-prod.eu3.k8saas.thalesdigital.iotohttp: no proxysetting.
- Add
code-companion-ca.ahe.tdp.infra.thalestohttp: no proxysetting.
- Add
code-companion.ahe.tdp.infra.thalestohttp: no proxysetting.
- Add
code-companion.tgs.cloud.thalestohttp: no proxysetting.
400 Bad Request
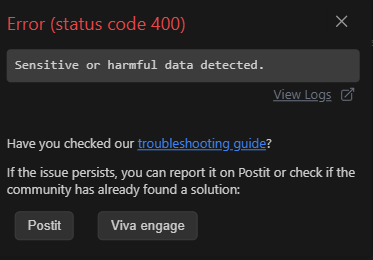
If you’re receiving the error message “400 Bad Request (“sensitive or harmful data detected”)” when trying to use Code Companion, it typically means there is sensitive or harmful data included in the context you’ve selected or your prompt. This happens because our integrated guardrails and the already existing Azure content filtering on Azure OpenAI models are designed to prevent the processing of such content, causing the 400 Bad Request error.
Workarounds:
- Review and Modify Content
- Ensure that your context or prompt does not include sensitive or harmful data. Remove or replace such data and try again.
- Minimize Sensitive Information
- If sensitive information is crucial, try redacting parts of the data without hindering context.
- Use the Right Extension
- For data above C2, consider using our C3-CA version which has a different integrated guardrail system.
We’re not allowed to share the list of forbidden words.
Authentication issues on VSCode
Check your VSCode version: on some installations where a proxy is involved, we recommend using VSCode versions >= 1.98.x
Check your connection method: If you are experiencing authentication errors, you can try switching your connection method as a temporary workaround. Here are the steps to follow:
- Switch to the classic authentication method.
- Sign out of your account.
- Switch to the MSAL authentication method.
- Sign back into your account.
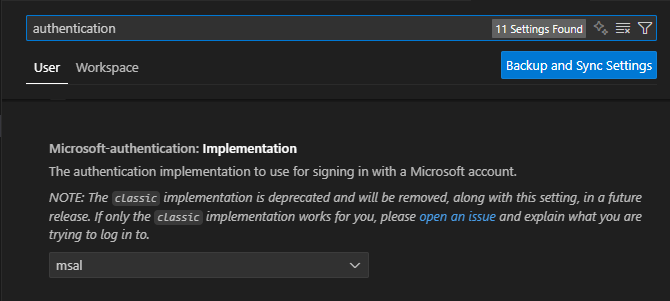
These steps can sometimes resolve authentication issues. In cases where the MSAL method is not functioning properly, switching to the classic method and then back to MSAL after signing out can help restore access.
Auth issues on macOS
On VSCode version 1.105.0 you may encounter authentication problems. To avoid,
we highly recommend changing the microsoft-authentication.implementation to
msal-no-broker, which will use your browser to authenticate instead.
For a step-by-step tutorial, check this post out.
Rules Don’t Appear in Assistant
Problem: Your rules exist but don’t show up in the rules toolbar.
Check These:
- File location: Ensure local rules are in
.continue/rules/(not.continue/rule/) - File format: Rules should be
.mdfiles with proper YAML frontmatter - Config reference: Hub rules must be referenced in
config.yaml - Assistant type: Ensure you’re using the correct assistant (local vs Hub)
Still having trouble?
If you have followed all the steps above and are still experiencing issues, please reach out for further assistance.