version v7.2.
For up-to-date documentation, see the
latest version.
Analytics
3 minute read
DevOps Adoption Analytics
GitLab’s DevOps Adoption feature provides visibility into how your teams are using GitLab’s capabilities on DevOps life cycle.
This analytics tool helps leadership and DevOps coaches measure and identify opportunities for improvement.
What is DevOps Adoption?
DevOps Adoption is a built-in dashboard that tracks DevOps usage across your instance or groups and subgroups.
It measures whether teams are actively using core GitLab features that represent DevOps best practices, providing a clear picture of your organization’s DevOps maturity.
The feature tracks 12 key capabilities across three categories:
| Category | Features Tracked |
|---|---|
| Development | Approvals, Code Owners, Issues, Merge Requests |
| Security | DAST, Dependency Scanning, Fuzz Testing, SAST |
| Operations | Deployments, Pipelines, Runners |
A feature is considered “adopted” when it has been used in any project within a group during the previous full calendar month.
Why Use DevOps Adoption Analytics?
DevOps Adoption provides objective and data-driven approach helps you make informed decisions about where to focus efforts.
Key Capabilities:
- Identify gaps: Quickly spot which teams are not leveraging security scanning or CI/CD features
- Measure progress: Track adoption trends over time using the “Adoption over time” chart
- Validate practices: Confirm your team is following DevOps best practices
- Actionable insights: The dashboard breaks down adoption by category (Dev, Sec, Ops), making it easy to see if teams are strong in one area but weak in another.
For Different Roles:
- DevOps Coaches: Demonstrate ROI of initiatives and target coaching where it’s most needed
- Team Leaders: Benchmark your team’s adoption against peers
- Organization Leadership: View adoption at multiple levels—from the entire organization down to individual subgroups—to identify pockets of excellence and areas requiring support
Understanding the Dashboard
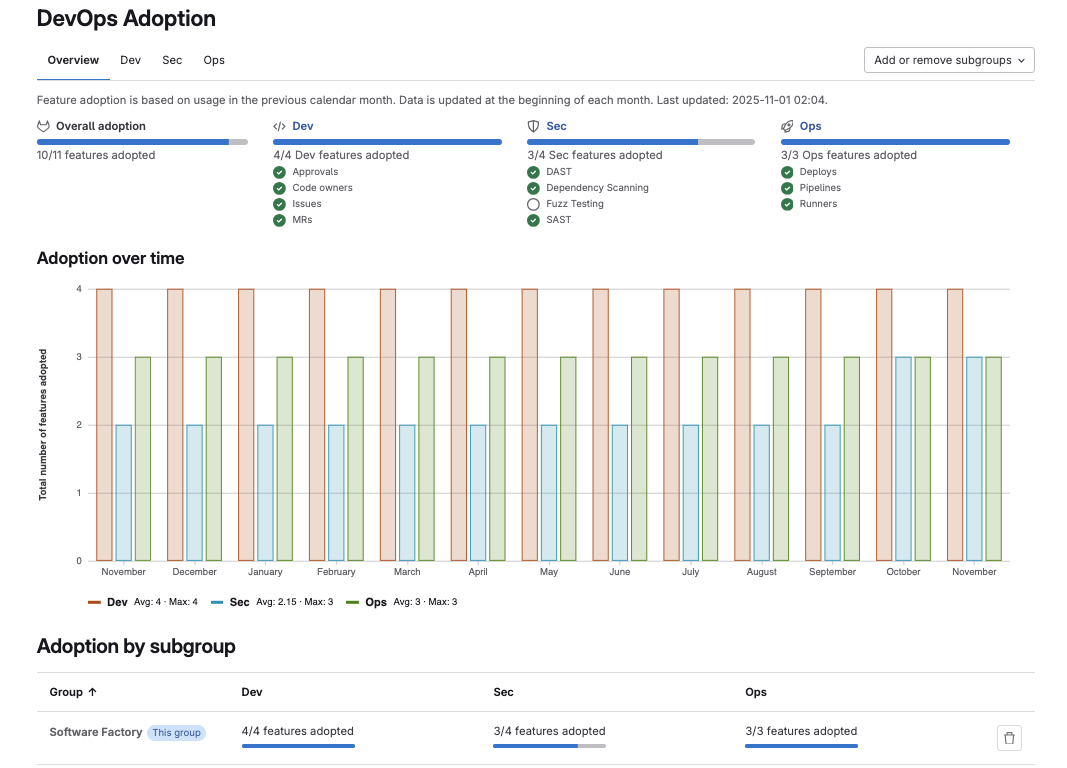
Overview Tab: Displays total features adopted across all categories. The “Adoption over time” chart shows historical data since you first enabled the feature.
Dev, Sec, Ops Tabs: Each tab breaks down feature adoption by subgroup. This granular view helps target coaching efforts.
Adoption by Subgroup Table: Quickly compare subgroups side-by-side to identify high-performers and teams needing support.
Important Considerations
DevOps Adoption tracks actual feature usage in the previous calendar month. A feature shows as adopted if it was used at least once in any project within the group.
DevOps analysis is binary: either adopted or not—regardless of frequency.
It does not measure :
- Usage frequency: A feature used once per month looks the same as one used 100 times
- New features: The metric is count of features adopted, not percentage of available features
- Quality of use: The feature measures adoption, not effectiveness or best practice compliance
Complementary Features
DevOps Adoption works alongside other GitLab analytics:
- Value Stream Analytics : Measures time from idea to production
- CI/CD Analytics : Tracks pipeline performance and success rates
- Code Review Analytics : Monitors merge request metrics
- DORA Metrics: Measures deployment frequency and lead time.