The site that you are currently viewing is a static version of the Software Factory
documentation delivered with the
version v7.2.
For up-to-date documentation, see the
latest version.
SonarQube
16 minute read

SonarQube is a Static Code Analysis tool designed to help you catch and fix code issues early in the Software Development Life Cycle (SDLC), before they become major production problems.
Static code analysis (also known as code scanning or linting) is the automated process of examining source code without executing it.
This process helps in identifying potential issues and vulnerabilities in the codebase, such as unparsable syntax, unreachable and unused code, duplicate code, potentially vulnerable code, leaked secrets, and violations of coding standards and conventions.
Info
This page describes the tool independently of any platform-specific details. For the service URL and other platform-specific configuration, please refer to your platform’s dedicated page .
Key Concepts
- Issue : Any detected problem (bug, vulnerability, or code smell)
- Quality Gate : Pass/fail criteria that code must meet
- Quality Profile : Set of rules applied during analysis
- Technical Debt: Estimated time to fix all code quality issues
Features Overview
We provide SonarQube instances in Enterprise Edition with the key features listed :
- Static Code Analysis: Analysis for more than 30 languages .
- Issues and Vulnerabilities Detection: identifies security flaws, bugs, and technical debt with severity rating.
- Quality Metrics History: Track and visualize code quality trends over time.
- Portfolio Management: Manage and monitor the quality of multiple projects within a single Portfolio/Application view.
- CI/CD Integration: Seamless integration with GitLab pipelines.
- Branch Analysis: Analyze multiple branches and merge requests independently.
- Reporting: Generate detailed reports for comprehensive quality overview.
Software Factory offer support for all these features, addressing any issues that may arise and provide guidance.
We do not offer support on vulnerability prevention, please contact your security partners for assistance with these matters.
Getting Started
Initial Setup and Configuration
Projects are typically created automatically during their first pipeline analysis. However, you can provision a project beforehand to configure settings before the initial scan.
Key Configuration Elements
- Project Key: Unique identifier following the format
GBU_BL_ProjectName(where ProjectName matches your GitLab project name) - Project Name: Display name visible in the web interface—should be descriptive and meaningful.
- Default Branch: Specify which branch SonarQube should treat as the main branch for New Code detection
(typically
main) - Project Visibility: Configure whether the project is private (restricted access) or public (visible to all authenticated users)
Software Factory Recommendations
Prefer to Pre-provision your projects so you can set a custom configuration;
otherwise, the default configuration will be setup.
Access Control and Permissions
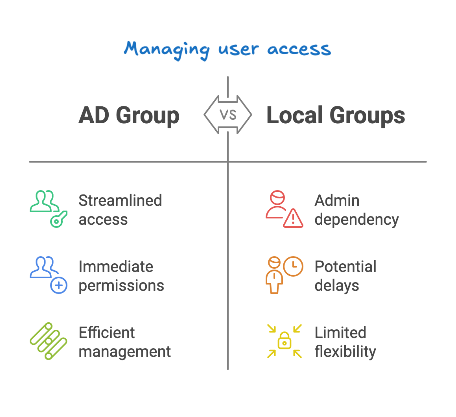
Recommended Approach: Active Directory (AD) Groups
We recommend that platform administrators manage permissions through AD groups rather than assigning them to individual users:
- Automatic access when new members join (via AD onboarding)
- No ticket request for user additions needed
- Centralized permission management
- Project managers control access without admin intervention
Permissions should be assigned to groups, not individuals. When users join an AD group, they inherit all associated SonarQube permissions automatically.
Note
Local Groups can be created by platform admins upon request, but this method requires back-and-forth communication and is not recommended.
Permission Levels
- Browse: View project results and issues
- See Source Code: View the project’s source code.
- Execute Analysis: Run scans and submit analysis results
- Administer Issues: Accept issues and Mark as False positive
- Administer Security Hotspots: Manage security hotspots and review their status
- Administer: Full project configuration and permission management
- Execute Analysis: Start an analysis on the project.
Permission Templates
Permission Templates provide a standardized approach to managing access control across SonarQube projects.
Instead of configuring permissions on each project individually, you can define reusable permission schemes that will apply automatically (for new projects) or on-demand (via request to your platform administrators).
Key Capabilities
Templates define permissions at both user and group level, specifying which teams or individuals can browse projects, execute analysis, or perform other project-level actions .
You can assign templates based on your project key patterns.
When access policies change, you can request template updates from administrators, who will propagate the new permissions and execute the template across all associated projects, eliminating the need to modify each project individually.
Note
Currently, permission template application to existing projects does not perform key pattern matching. Provide the target project list directly to your administrators for manual application.
Example
A typical permission template for production applications might be configured as follows:
Template Name: GBU-BL-projects-xxx
Project Key Pattern: gbu-bl-proj.*
Permissions:
- Browse & See Source Code:
proj-devsgroup,proj-qagroup - Execute Analysis:
cicd-service-accountuser,proj-devopsgroup - Administer Issues:
proj-devopsgroup,proj-ownersgroup - Administer Security Hotspots:
user001user,proj-devopsgroup - Administer:
proj-ownersgroup
This template ensures that all projects with keys starting with gbu-bl-proj automatically
receive consistent permissions.
Tokens
See dedicated Secret page .
Code Analysis Process
The main steps for the analysis:
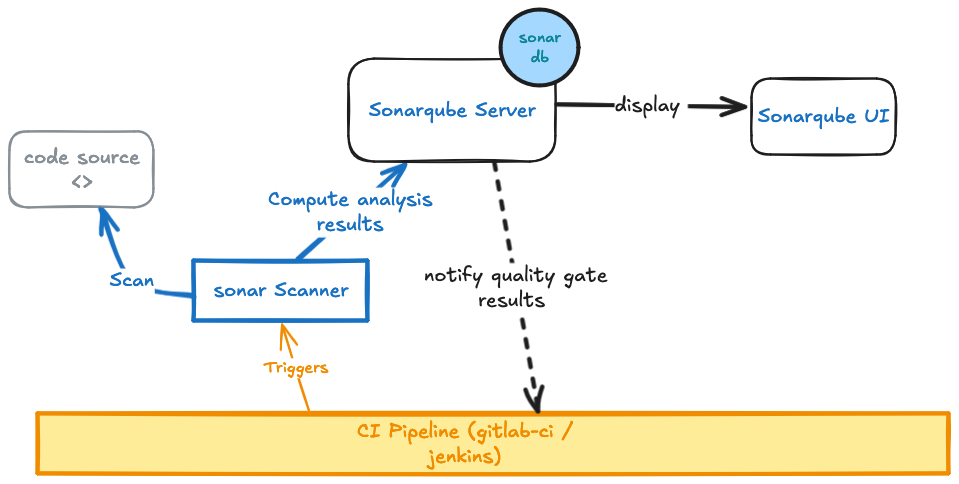
- Launch CI Pipeline: Your CI/CD pipeline starts the SonarScanner
- Determine Analysis Scope: SonarScanner scans the local repository and determines which files to analyze based on configured scope
- Language Analysis Request: Scanner sends an analysis request to the respective language analyzer
- Files Analysis: Language analyzer retrieves files from the file system and analyzes them according to configured Quality Profiles
- Results Collection: Analyzer sends results (metrics and issues) back to the scanner
- Report Submission: Scanner forwards the analysis report to the SonarQube Server
- Server Computation: Server processes the report to:
- Identify new issues (bugs, vulnerabilities, code smells)
- Compute Quality Gate status
- Generate reports and dashboards
- Quality Gate Result: Server sends Quality Gate status back to CI pipeline, which continues or stops (if failed)
Managing your code
To make the most out of SonarQube and avoid unnecessary noise, it’s important to implement specific practices concerning the selection of files for scanning.
- Use
sonar.inclusionsandsonar.exclusionsproperties to precisely control which files should be analyzed. You can read more on analyze scoping . - Use annotations (
//NOSONAR) in your source code to instruct SonarQube to ignore certain lines or blocks of code. - Create a Clear Folder Structure in your codebase to facilitate easy exclusion and inclusion of relevant files during SonarQube analysis.
Tip
SonarQube scans may not be relevant for certain type of files, so it is advisable to exclude:
- Generated code: Files generated by build systems which are not part of your source code
- Source code from third-party libraries: should not be analyzed as it is outside your control
Developers are strongly encouraged to write unit tests as part of shift left approch .
SonarQube allows a measurement of code coverage, helping to pinpoint untested sections of the codebase, and by improving coverage, teams can ensure higher quality standards and maintainability.
Pitfalls to avoid
- Aim for high coverage, but balance this with the quality of testing critical parts of the code.
- Focus on the quality of tests, ensuring they adequately cover edge cases and potential points of failure rather than merely increasing coverage percentages.
SonarScanner
The SonarScanner is a crucial component for performing source code analysis . This stand-alone program is responsible for executing the code scan and sending the results to the SonarQube server.
Here’s a more detailed breakdown of SonarScanner functionality:
- Operates on the Continuous Integration/Continuous Deployment (CI/CD) host machine.
- Analyzes the source code according to the specified configurations and the programming languages being used.
- Sends the results to the SonarQube server, after the analysis is completed.
You can find more information and download SonarQube scanners by visiting official documentation
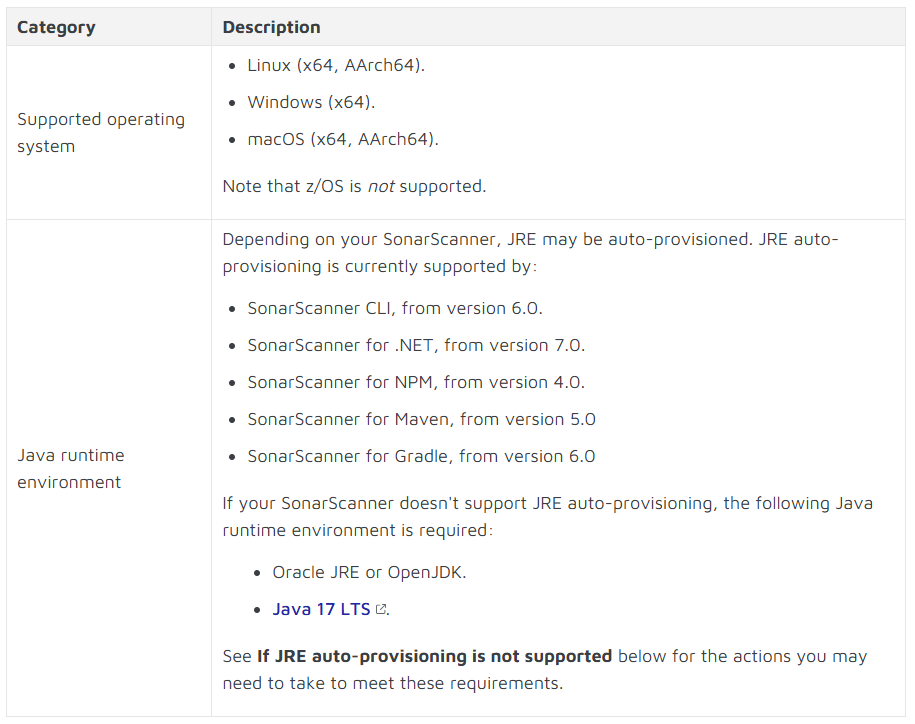
The table below describes what is required
to run the scanner that performs analysis:
SonarQube Plugins
SonarQube plugins are modular components that extend the capabilities of the SonarQube platform.
They allow users to benefit from new features or enhance existing ones to better meet the specific requirements of their development environment.
Plugins can include additional static analysis rules, integrations with other DevOps tools, support for new programming languages or frameworks, custom metrics, dashboards, and more.
Info
You can check the list of Software Factory supported plugins for more details.
Please note that this list may vary depending on the platform you use.
Quality Management
Quality Rules
During the analysis, when a rule is not followed it raise an issue:
Issue: A problem or defect detected in source code that violates a rule and can potentially impact software quality and maintainability.
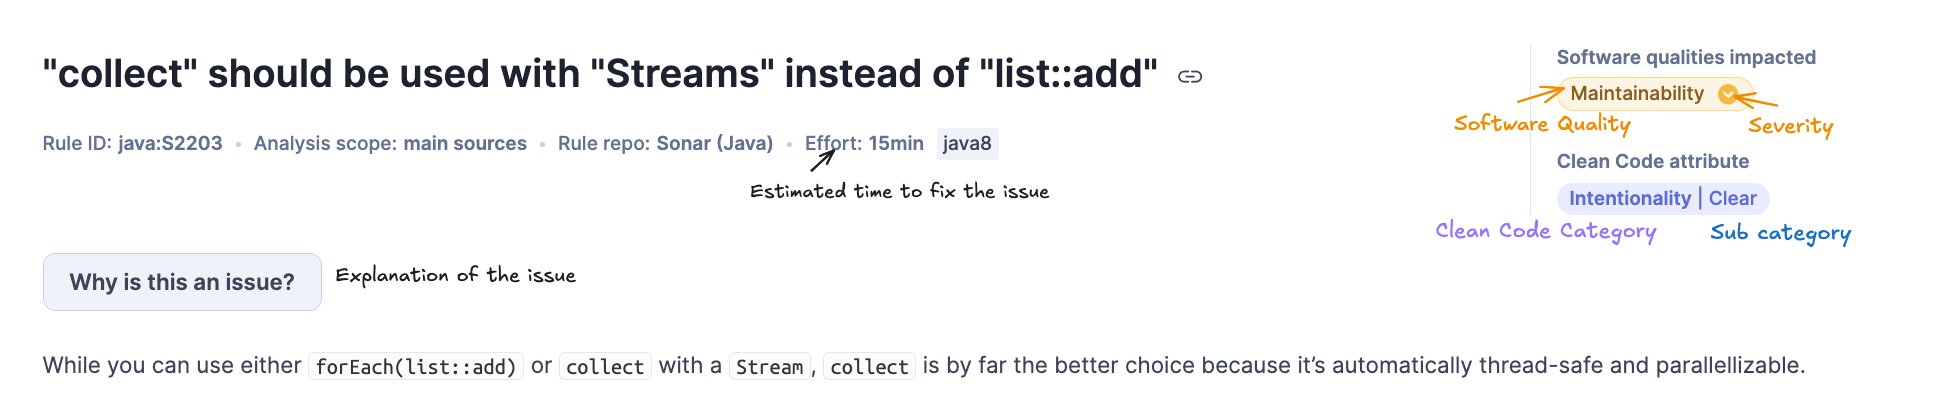
An issue is defined by:
- Rule ID: Reference to the broken coding standard or practice. Each language has its own rule set.
- Effort: Estimated time required to fix the issue.
- Software Quality Impact 🆕: Categorizes issues by their impact on:
- Security: Protection against threats (SQL injection, XSS, insecure cryptography)
- Reliability: How well code handles failures and performs as intended
- Maintainability: Ease of understanding, updating, and improving code
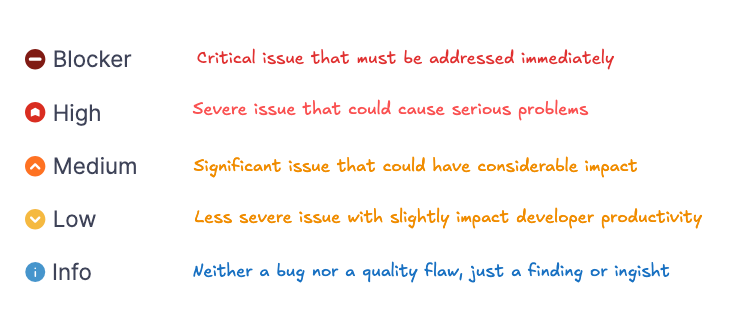
- Severity: Determined by the issue’s impact on software quality:
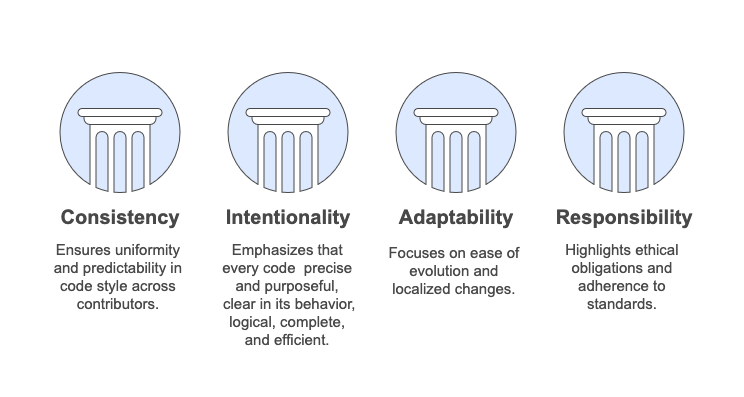
- Clean Code Attribute 🆕: New metric in SonarQube 2025.1 with four pillars:
- Consistency: Uniform code style and conventions across the codebase (Formatted,Conventional,Identifiable)
- Intentionality: Precise, purposeful code with clear behavior
- Adaptability: Structured for easy evolution with localized changes (Focused, Distinct, Modular,Tested)
- Responsibility: Ethical, lawful, and respectful code
You can find more on SonarQube Issue Categories
Quality Profiles and Management
Quality Profiles define the rule sets applied during code analysis. Each supported language has its own profile, which can be customized to align with your coding standards.
Management Best Practices
At Configuration level:
- Start with default profiles and customize as needed
- Name custom profiles clearly with Business Line and GBU prefix (e.g., GBU_BL_Java_CustomRules)
- Standardize profiles across projects for organizational consistency
- Document your profiles and included rules for team clarity
At Maintenance:
- Regularly review the Deprecated Rules section after plugin/SonarQube updates
- Restrict Administer Quality Profile privileges to authorized users only
- Keep clear documentation to help teams understand and apply rules
Built-in Quality Profiles cannot be edited and only users with Administer Quality Profile right can:
- Extend profiles and modify rules
- Delete custom profiles
- Grant modification privileges to others for specific profiles
To Platform Admin
Avoid granting Administer Quality Profile Global Permissiont all users.
Tip
Once a language is added to a project, it cannot be removed (but you can change its profile)
If you add a language by mistake: link it to a custom profile and disable all rules
🧰 You can also learn more on how to manage quality profiles .
Quality Gates and Management
Quality Gates are pass/fail criteria that code must meet before it can be merged or deployed. They are a powerful tool as they enforce minimum quality standards by checking metrics like:
- Code coverage thresholds
- Number of new bugs/vulnerabilities
- Technical debt ratio
- Duplicated code percentage
- Security hotspot review rate
How Quality Gates Work
- Analysis completes and metrics are computed
- SonarQube evaluates metrics against Quality Gate conditions
- Gate passes (✅) or fails (❌)
- CI/CD pipeline can proceed or be blocked based on result
Software Factory Recommendations
- Start with the default “Sonar way” Quality Gate
- Customize conditions to match your quality requirements
- Set realistic thresholds that improve over time
- Focus conditions on New Code rather than overall code (encourages continuous improvement)
- Communicate Quality Gate requirements clearly to development teams
- Regularly review and adjust conditions based on project maturity
- Use Quality Gate Badges in project documentation for visibility
📖 Learn more about the quality gates by visiting SonarQube Quality Gate .
Issues and Security
Issues Management Workflow
SonarQube provides integrated tools to identify, review, assign, and track issues directly.
On Issue Review and Triage:
- Review each issue to determine if it’s a genuine problem or false positive
- Use issue statuses appropriately:
- Open: Issue requires action
- Confirmed: Validated as a real issue needing fix
- Resolved as Won’t Fix: Valid issue but intentionally not addressing (document why)
- Resolved as False Positive: Incorrectly flagged by analyzer-
- Add comments explaining decisions for team visibility and knowledge sharing
On Issue Prioritization:
- Focus on Security vulnerabilities and Blocker/Critical bugs first
- Address Major bugs that affect reliability
- Tackle Code smells and Maintainability issues during regular refactoring cycles
On Assignment and Resolution:
- Assign issues to appropriate team members (code owners or experts in affected areas)
- Set realistic fix timelines based on issue severity and effort estimates
- Incorporate technical debt reduction into sprint planning—don’t defer indefinitely
- Link issues to tasks/tickets in your project management system for tracking
Reporting and Monitoring:
- Use SonarQube’s activity board and reports to track the progress of issue resolution over time.
- Share these reports regularly with stakeholders to keep them informed about code quality and technical debt.
Software Factory Recommendations
- Establish a “Definition of Done” that includes passing Quality Gates
- Review issues during code reviews, not just after analysis
- Don’t ignore issues indefinitely—address or explicitly mark as
Won't Fix - Use issue filters to focus on specific types, severities, or time periods
📖 For detailed steps on how teams should manage and resolve issues, refer to our Issue Management Tutorial
Secret Detection
🆕 SonarQube can detects hardcoded secrets in your codebase to prevent credential leaks and security breaches.
List of secrets what SonarQube detects:
- API keys and tokens (AWS, Azure, Google Cloud, GitHub, etc.)
- Database passwords and connection strings
- Private keys and certificates
- OAuth tokens and client secrets
- Encryption keys and salts
- Authentication credentials
Warning
Secret detection scans cannot protect against secrets already committed to version control history.
📖 You can find some guidances in our Secret Detection Practice page.
Dashboards & Reporting
Project Dashboard
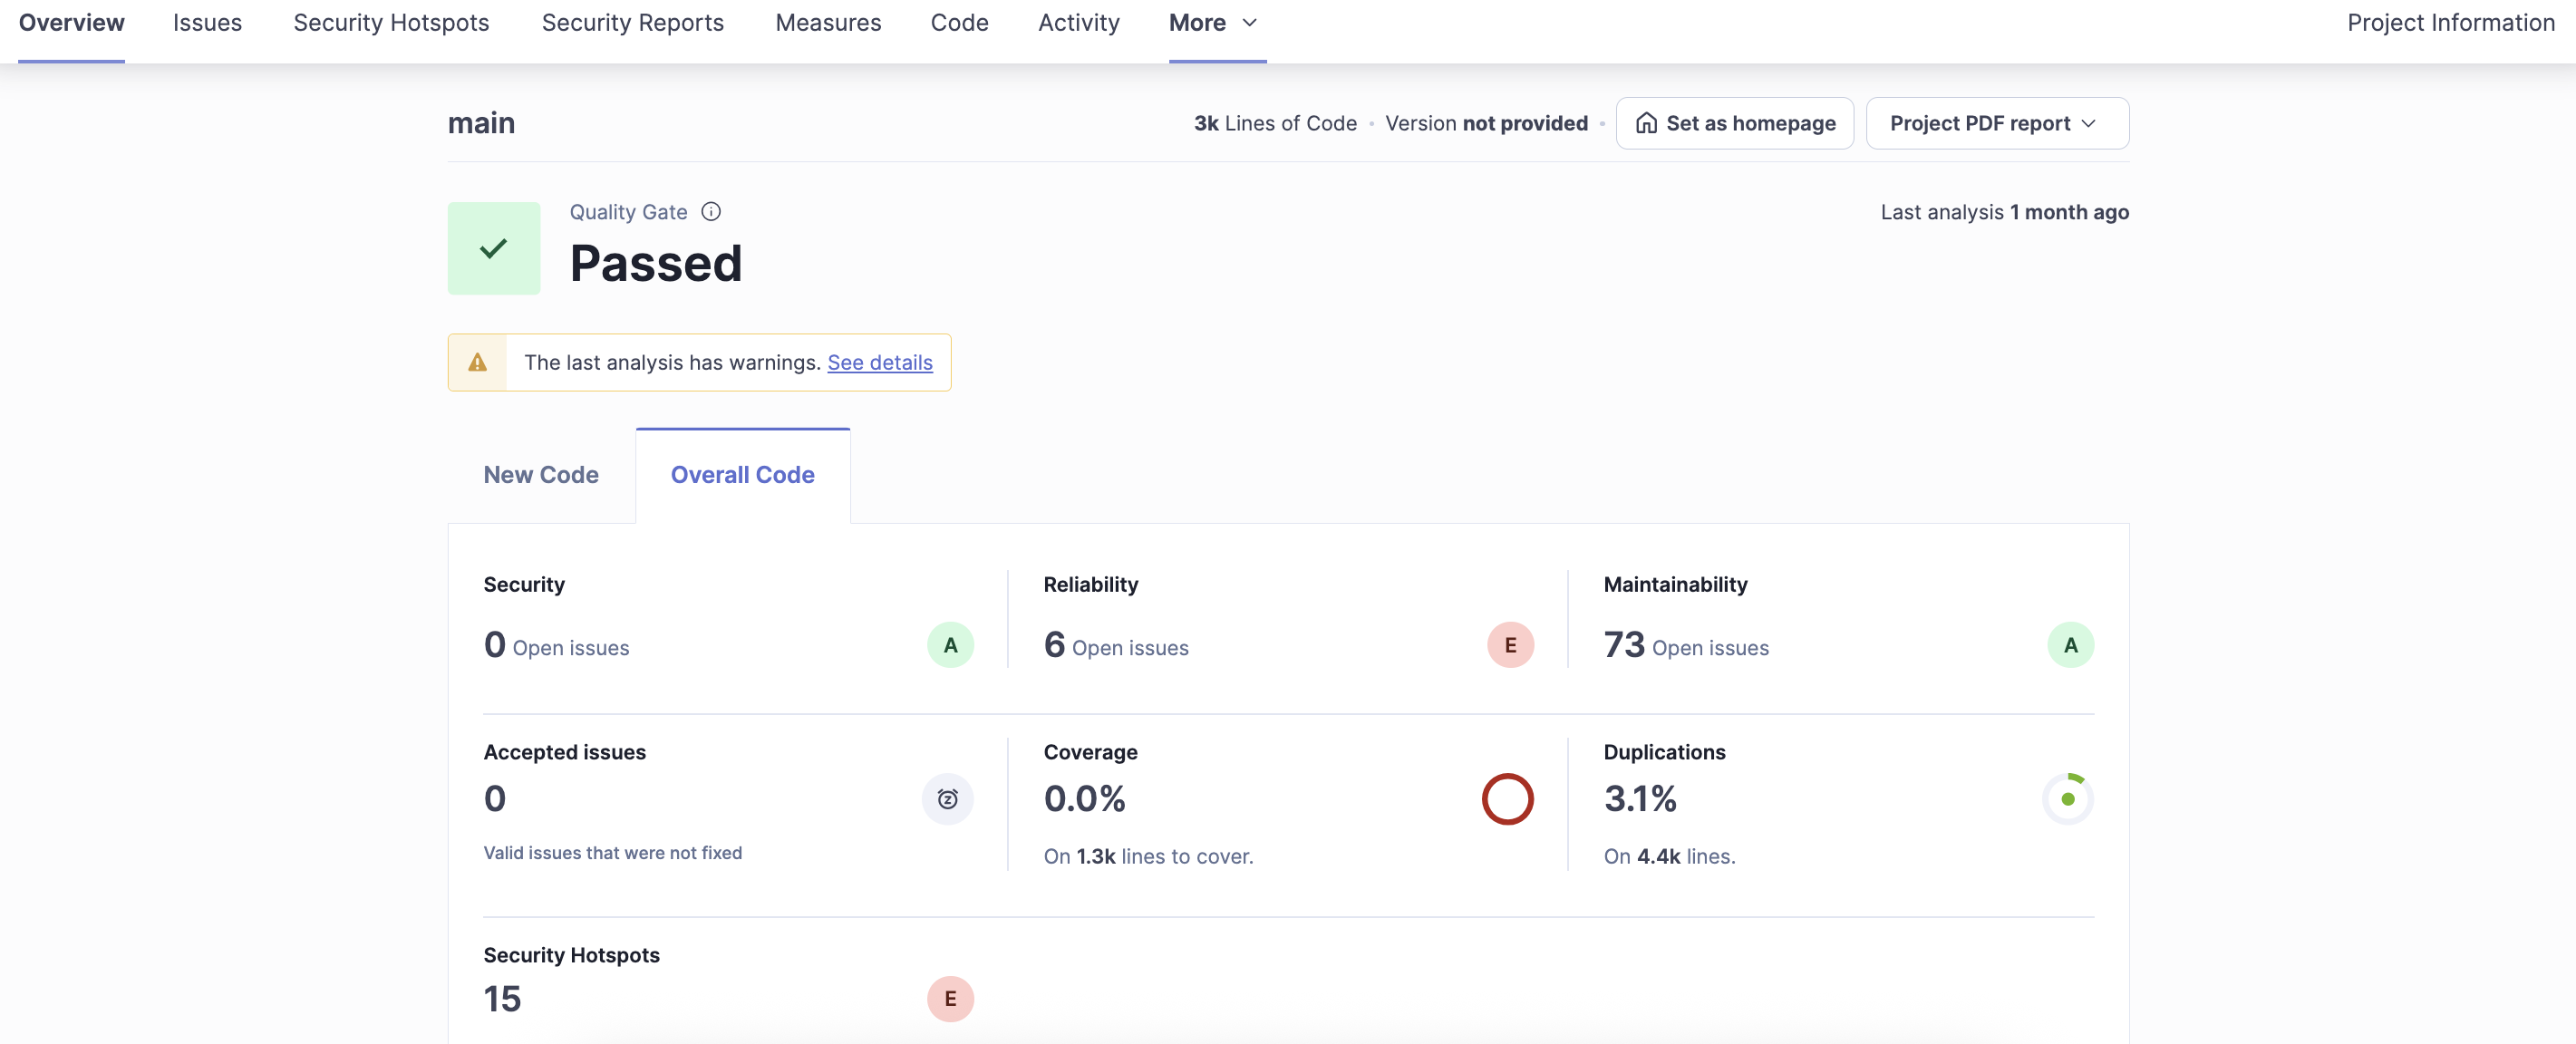
Dashboards provide a comprehensive view of your project’s code quality, allowing you to monitor and track various metrics over time.
They help in identifying trends, spotting issues early, and making informed decisions to improve code quality.
- Project Summary: the overall health, including key metrics such as Reliability (Bugs), Security Vulnerabilities, Maintainability (Code Smells), Coverage, and Duplications.
- Metrics: A metric may be either qualitative (for example, the density of duplicated lines, line coverage by tests, etc.) or quantitative (for example, the number of lines of code, the complexity…)
- Activity Graph: Visual representation of the project’s quality trends over time, helping you see improvements or regressions.
- Quality Gate Status: Green or red depending on if the project has met the predefined quality criteria.
- Project Settings: Project’s managers can administer and configure the project for actions like changing quality profiles, import/export data, handle permissions…
- Project Information: Display basic information about the project like number of line of code, quality profiles and gates used, project key and a generator for badges
- New Code : displays metrics for code added or updated since the New Code Period started. Focus on recent changes to ensure new code meets quality standards.
- Overall Code Shows metrics for all code in the project, including both old and new code. Broad overview of entire codebase quality.
Software Factory Recommendations
- Ensure that all team members are familiar with the dashboard and its metrics.
- Display the main dashboard daily to address any drops in quality promptly.
- Track technical debt and allocate time for quick-win fixes (low remediation cost issues). Project history is a important key feature
- Setup [new code definition].
- Clean project snapshot if there is a problem with analysis, so you can keep a clean history of your code quality.
Application Dashboard
An application aggregates multiple SonarQube projects into a consolidated view, allowing you to analyze and monitor multiple related projects as a single entity.
This is particularly useful for larger interconnected systems or microservices architectures.
The following benefits can be achieved through Applications:
- Centralized Management: Managing multiple projects by using a single quality gate, quality profile, and analysis dashboard for all included projects.
- Unified Reporting: Ensure consistent reporting and quality tracking across all related projects.
- Easier Maintenance: Minimize the overhead related to maintaining large sets of projects individually.
Portfolio Dashboard
A Portfolio provide a executive overview of the health of a set of Projects or Applications.
This feature enables users to manage and monitor multiple projects collectively, ensuring that quality and security standards are consistently upheld across the board.
The Portfolio dashboard is a Unified view of all aggregated project information in one place, it helps to oversee the performance of multiple projects, identifying areas needing attention.
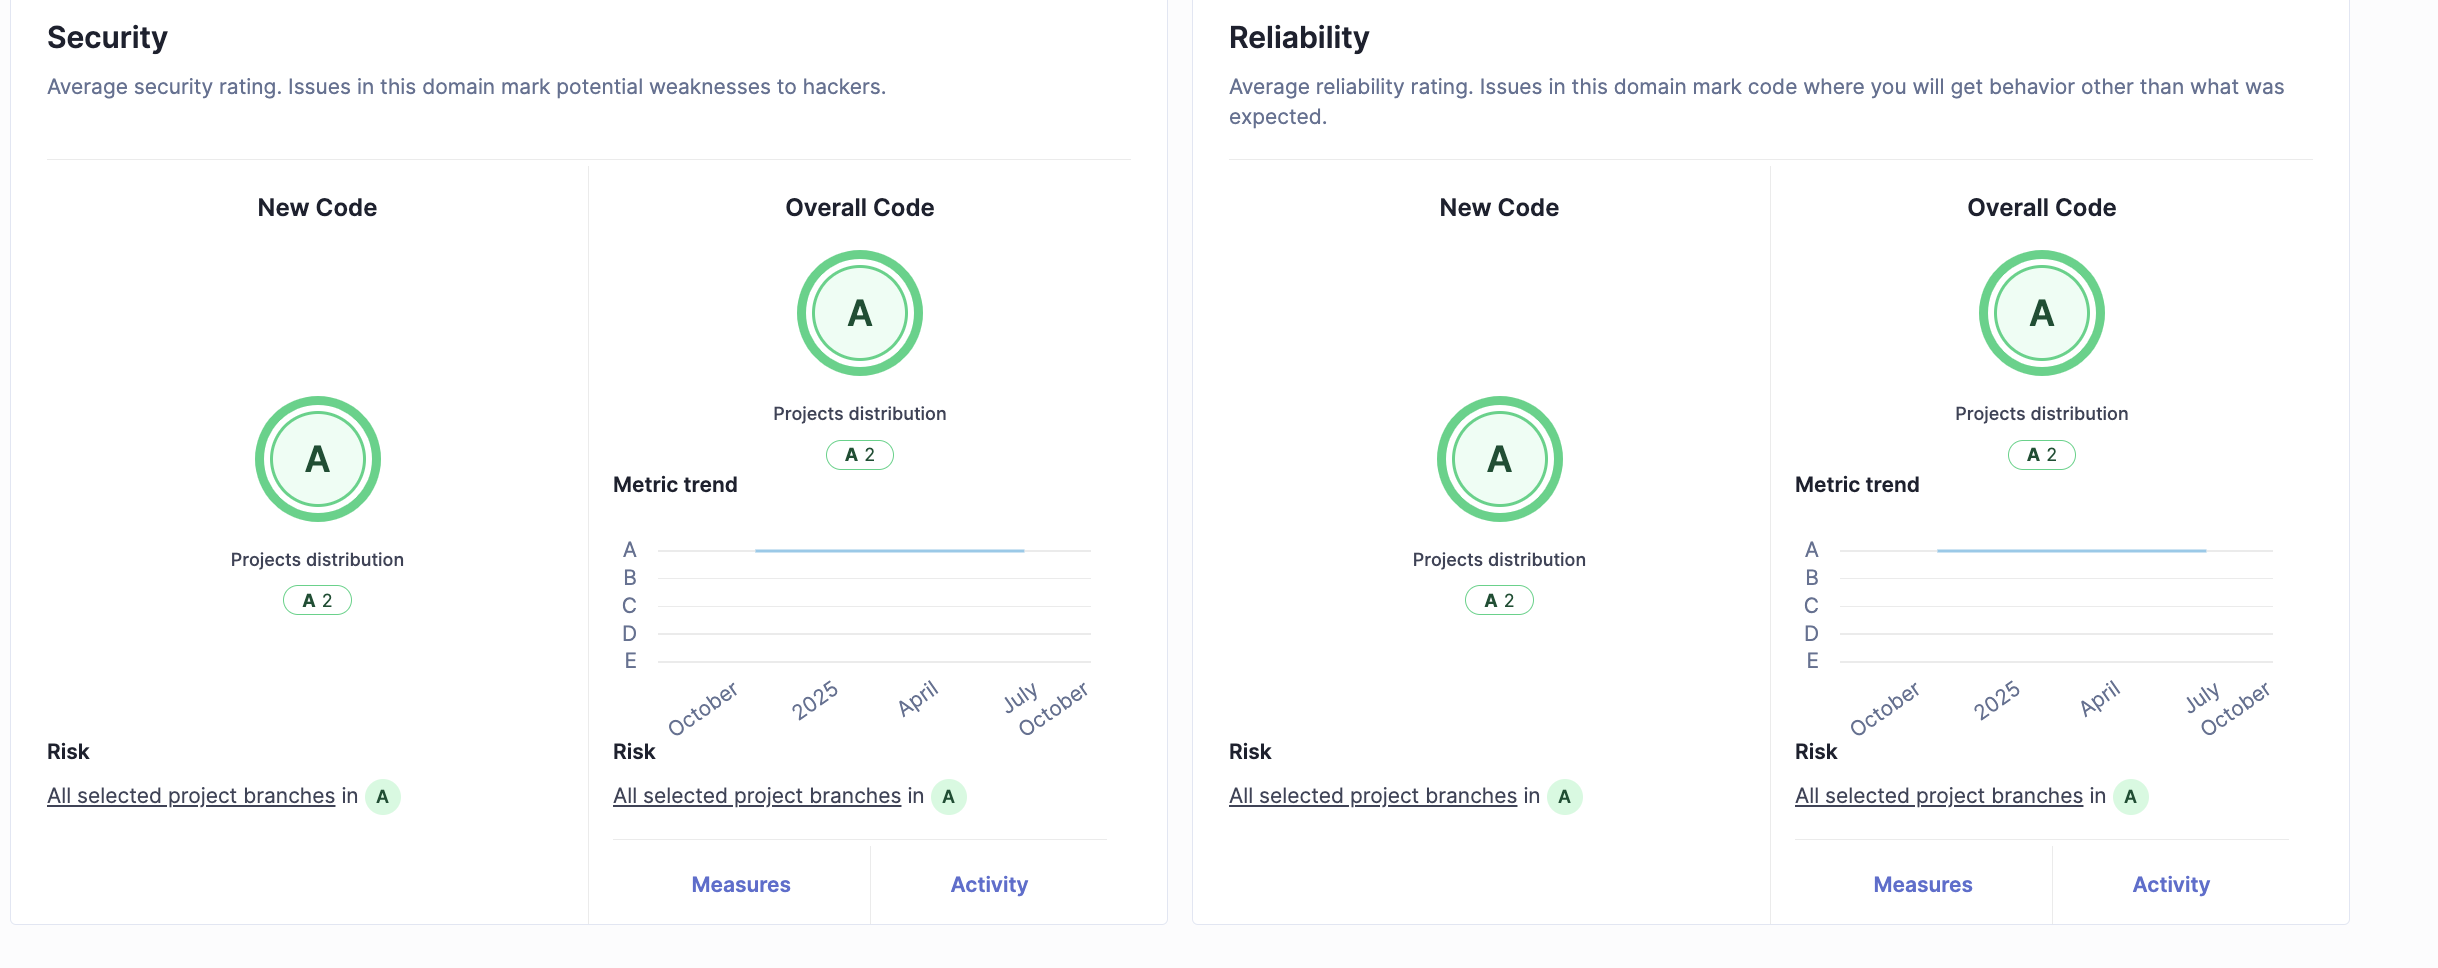
Each project have it’s own metrics and the Portfolio show the medium value of the Projects for strategic decision-making.
🧰 For more information on managing portfolios, see the how to organize your projects .
Security Report
SonarQube provides security reporting that serve as evidence of code quality and security compliance.
These report are designed to provide insights into security risks and demonstrating quality management.
Track compliance with industry standards:
- OWASP Top 10 (web application security risks)
- CWE Top 25 (common weakness enumeration)
- PCI DSS (payment card industry requirements)
- OWASP ASVS (application security verification standard)
Accessing Security Reports
- Project Level: Navigate to Security Hotspots or Security tab in your project
- Portfolio Level: View aggregated security metrics across multiple projects
- Security Report PDF: Generate executive summaries for stakeholders (Enterprise Edition)
📖 For more details, refer to SonarSource Official Documentation at Security Reports Overview .
SonarQube Badge
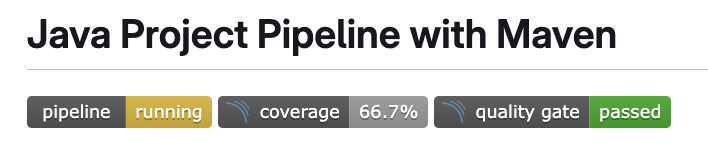
There are visual indicators showing project quality metrics like code coverage, bugs, vulnerabilities, and code smells to improve code quality by tracking relevant metrics easily.
Software Factory Recommendations
- Display badges on project repositories to indicate code quality status.
- Highlight metrics such as code coverage, bugs, vulnerabilities, and code smells using badges.
- Share these badges in documentation and on websites to demonstrate a commitment to quality.
- Set goals for your team to improve badge metrics and encourage continuous improvement.
- Utilize badges as a visual tool to promote transparency and accountability in maintaining code quality.
🧰 Visit our detailed How to set up badge code for more guidance.
Development Workflow
Continuous Integration
Integrating SonarQube with your CI/CD pipelines allows automated code quality checks, ensuring that new code meets defined quality standards right from the start.
Here are key strategies for CI/CD integration:
- Automated Analysis Trigger: Configure build pipelines to trigger SonarQube analysis whenever a merge request is opened or changes are pushed to the repository.
- Quality Gate Enforcement: Set the CI pipelines to fail if the code does not pass the quality gates
🧰 We provide various tutorials on coding languages :
You can also follow this tutorial to create your first Python CI pipeline .
Project Branches
Branches in SonarQube represent different lines of development, often associated with feature development, bug fixes, or versions.
Branches can be configured to have different quality gates, enabling more specific and targeted quality compliance during different stages of development.
Inactive Branches and Cleanup
SonarQube’s automated housekeeping for branches is an event-driven process. It does not run on a fixed global schedule (for example, daily at midnight).
Instead, the cleanup of inactive branches is triggered only when a project analysis successfully completes.
Once the Inactive Branches threshold (30 days by default, configurable at project level) is crossed, a branch is considered expired.
A new analysis report for the project is required to initiate the housekeeping task. During this background task, SonarQube scans all expired branches for that project and removes them.
As a result, inactive branches can remain visible in the SonarQube UI for an extended period until a new analysis “wakes up” the cleanup engine for that project.
SonarQube for IDE

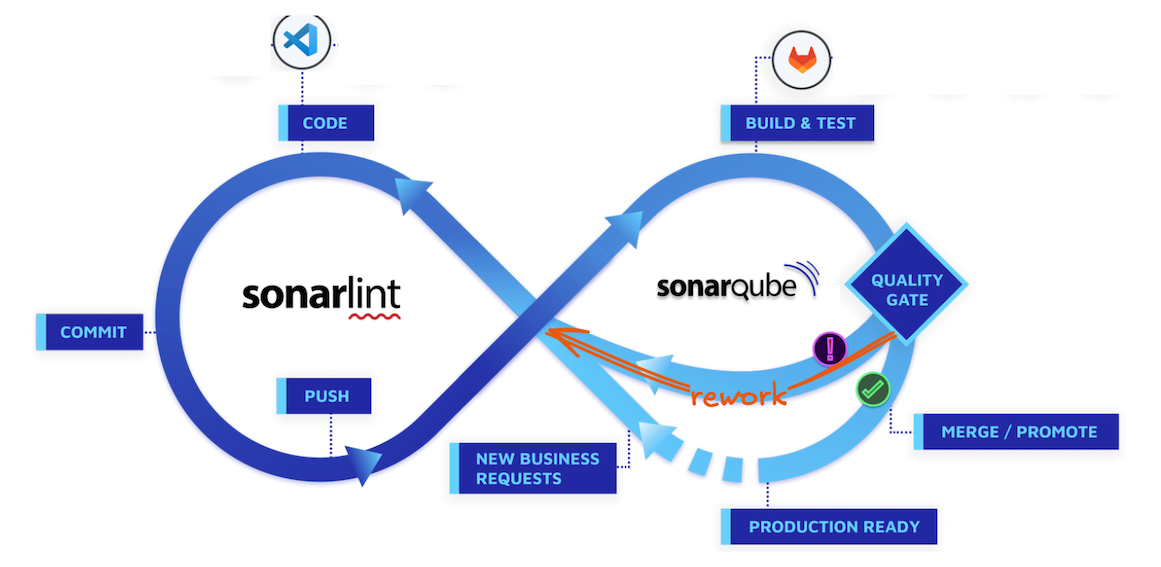
To detect static code issues earlier, you can use SonarQube IDE integrated with your IDE, such as Visual Studio Code or IntelliJ .
SonarLint helps you find issues as you write your code, directly within your favorite IDE. It acts as an early line of defense against potential bugs and code smells, ensuring cleaner code from the code phase.
This approach is referred to as Clean As You Code.
Clean as You Code is an approach to code quality that eliminates many of the challenges that come with traditional approaches.
As a developer, you focus on maintaining high standards and taking responsibility specifically in the new code you’re working on.
SonarQube gives you the tools to set high standards and take pride in knowing that your code meets those standards.
For optimal integration, set up the Connected Mode for SonarLint in Visual Studio Code.
This will bind your local workspace to your SonarQube server, ensuring alignment with its rules and settings.
🧰 You can follow the procedure to Install SonarQube IDE in VS code .
Useful resources
Instructions
- For more detailed information, you can also visit our how to use for SonarQube
- You can learn about How to monitor EcoDesign with SonarQube
- You can also find informations about how to organize your projects
Note
Learn more others SAST tools like GitLab and Coverity available in the Software Factory.